plot circles
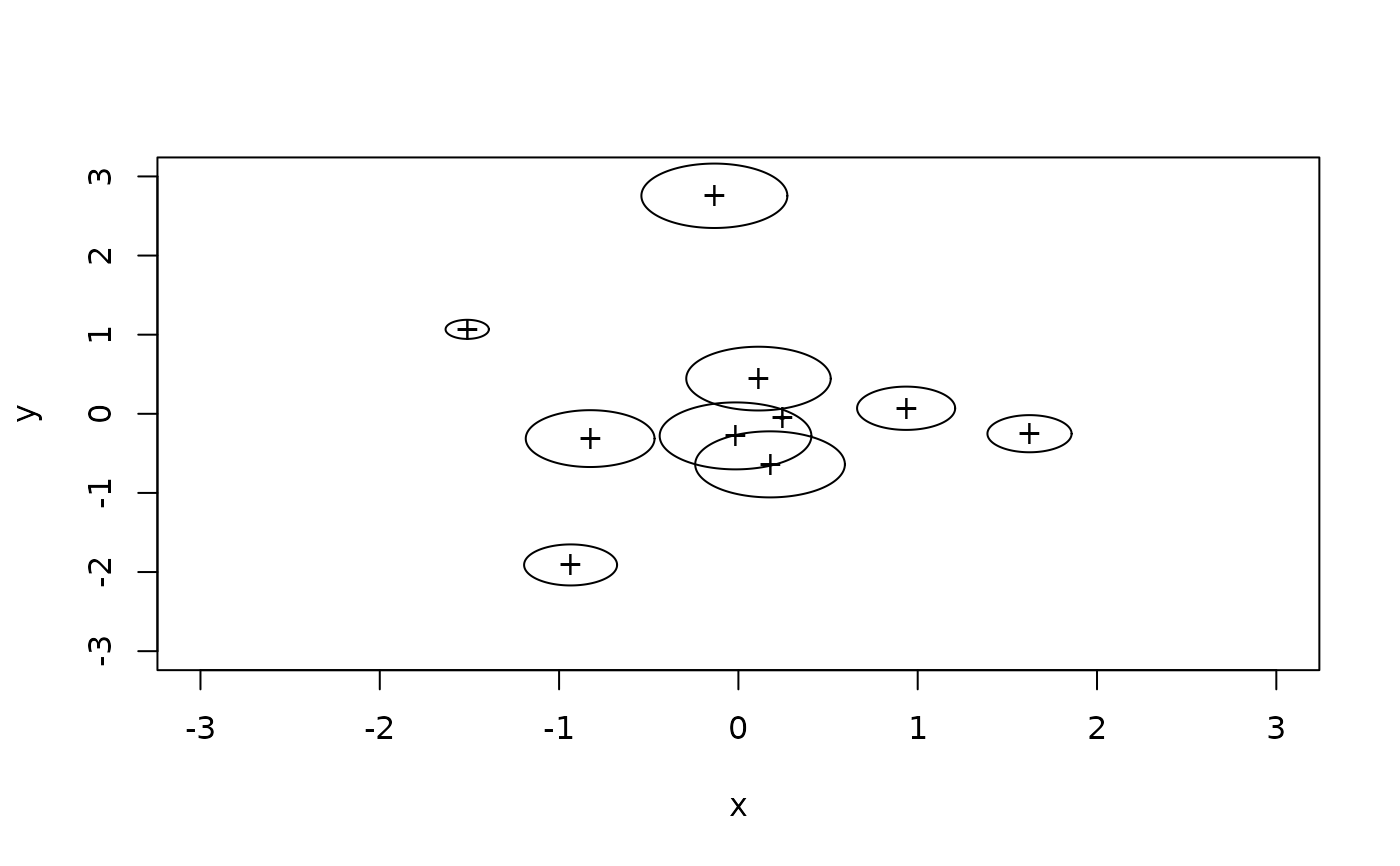
circles.RdThis function plots circles at given locations with given radii.
circles(x, y, r, ...)Arguments
Note
This function needs a previous plot where it adds the circles.
circles.RdThis function plots circles at given locations with given radii.
circles(x, y, r, ...)This function needs a previous plot where it adds the circles.