Trellis Hexbin Displays
hexbinplot.RdDisplay of hexagonally binned data, as implemented in the
hexbin packge, under the Trellis framework, with associated
utilities. hexbinplot is the high level generic function, with
the "formula" method doing the actual work.
prepanel.hexbinplot and panel.hexbinplot are associated
prepanel and panel functions. hexlegendGrob produces a
suitable legend.
Usage
hexbinplot(x, data, ...)

# S3 method for class 'formula'
hexbinplot(x, data = NULL,
           prepanel = prepanel.hexbinplot,
           panel = panel.hexbinplot,
     groups = NULL,
           aspect = "xy",
           trans = NULL,
           inv = NULL,
           colorkey = TRUE,
           ...,
           maxcnt,
           legend = NULL,
           legend.width = TRUE,
           subset)

prepanel.hexbinplot(x, y, type = character(0), ...)

panel.hexbinplot(x, y, ..., groups = NULL)

hexlegendGrob(legend = 1.2,
              inner = legend / 5,
              cex.labels = 1,
              cex.title = 1.2,
              style = "colorscale",
              minarea = 0.05, maxarea = 0.8,
              mincnt = 1, maxcnt,
              trans = NULL, inv = NULL,
              colorcut = seq(0, 1, length = 17),
              density = NULL, border = NULL, pen = NULL,
              colramp = function(n) { LinGray(n,beg = 90,end = 15) },
              ...,
              vp = NULL,
              draw = FALSE)
Arguments
- x
For
hexbinplot, the object on which method dispatch is carried out.For the
"formula"methods, a formula describing the form of conditioning plot. Formulas that are valid forxyplotare acceptable.In
panel.hexbinplot, the x variable.- y
In
panel.hexbinplot, the y variable.- data
For the
formulamethod, a data frame containing values for any variables in the formula, as well asgroupsandsubsetif applicable (usinggroupscurrently causes an error with the default panel function). By default, the environment where the function was called from is used.- minarea, maxarea, mincnt, maxcnt, trans, inv, colorcut, density, border, pen, colramp, style
see
gplot.hexbin- prepanel, panel, aspect
See
xyplot.aspect="fill"is not allowed. The current default of"xy"may not always be the best choice, oftenaspect=1will be more reasonable.- colorkey
logical, whether a legend should be drawn. Currently a legend can be drawn only on the right.
- legend.width, legend
width of the legend in inches when
styleis"nested.lattice"or"nested.centroids". The namelegend.widthis used to avoid conflict with the standard trellis argumentlegend. It is possible to specify additional legends using thelegendorkeyarguments as long as they do not conflict with the hexbin legend (i.e., are not on the right).- inner
Inner radius in inches of hexagons in the legend when
styleis"nested.lattice"or"nested.centroids".- cex.labels, cex.title
in the legend, multiplier for numeric labels and text annotation respectively
- type
character vector controlling additional augmentation of the display. A
"g"intypeadds a reference grid,"r"adds a regression line (y on x),"smooth"adds a loess smooth- draw
logical, whether to draw the legend grob. Useful when
hexlegendGrobis used separately- vp
grid viewport to draw the legend in
- ...
extra arguments, passed on as appropriate. Arguments to
gplot.hexbin,xyplot,panel.hexbinplotandhexlegendGrobcan be supplied to the high levelhexbinplotcall.panel.hexbinplotcalls one of two (unexported) low-level functions depending on whethergroupsis supplied (although specifyinggroupscurrently leads to an error). Arguments of the appropriate function can be supplied; some important ones arexbins:number of hexagons covering x values. The number of y-bins depends on this, the aspect ratio, and
xbndsandybndsxbnds, ybnds:Numeric vector specifying range of values that should be covered by the binning. In a multi-panel display, it is not necessarily a good idea to use the same bounds (which along with
xbinsand the aspect ratio determine the size of the hexagons) for all panels. For example, when data is concentrated in small subregions of different panels, more detail will be shown by using smaller hexagons covering those regions. To control this,xbndsandybndscan also be character strings"panel"or"data"(which are not very good names and may be changed in future). In the first case, the bounds are taken to be the limits of the panel, in the second case, the limits of the data (packet) in that panel. Note that all panels will have the same limits (enough to cover all the data) by default ifrelation="free"in the standard trellis argumentscales, but not otherwise.
- groups
in
hexbinplot, a grouping variable that is evaluated indata, and passed on to the panel function.- subset
an expression that is evaluated in evaluated in
datato produce a logical vector that is used to subset the data before being used in the plot.
Details
The panel function panel.hexbinplot creates a hexbin object
from data supplied to it and plots it using
grid.hexagons. To make panels
comparable, all panels have the same maxcnt value, by default
the maximum count over all panels. This default value can be
calculated only if the aspect ratio is known, and so
aspect="fill" is not allowed. The default choice of aspect
ratio is different from the choice in hexbin (namely,
1), which may sometimes give better results for multi-panel
displays. xbnds and ybnds can be numeric range vectors
as in hexbin, but they can also be character strings specifying
whether all panels should have the same bins. If they are not, then
bins in different panels could be of different sizes, in which case
style="lattice" and style="centroids" should be
interpreted carefully.
The dimensions of the legend and the size of the hexagons therein are
given in absolute units (inches) by legend.width and
inner only when style is "nested.lattice" or
"nested.centroids". For other styles, the dimensions of the
legend are determined relative to the plot. Specifically, the height
of the legend is the same as the height of the plot (the panel and
strip regions combined), and the width is the minimum required to fit
the legend in the display. This is different in some ways from the
hexbin implementation. In particular, the size of the hexagons
in the legend are completely unrelated to the sizes in the panels,
which is pretty much unavoidable because the sizes need not be the
same across panels if xbnds or ybnds is "data".
The size of the hexagons encode information when style is
"lattice" or "centroids", consequently a warning is
issued when a legend is drawn with wither of these styles.
Value
hexbinplot produces an object of class "trellis". The
update method can be used to update components of the object and
the print method (usually called by default) will plot it on an
appropriate plotting device. hexlegendGrob produces a
"grob" (grid object).
Author
Deepayan Sarkar deepayan.sarkar@r-project.org
Examples
mixdata <-
data.frame(x = c(rnorm(5000),rnorm(5000,4,1.5)),
y = c(rnorm(5000),rnorm(5000,2,3)),
a = gl(2, 5000))
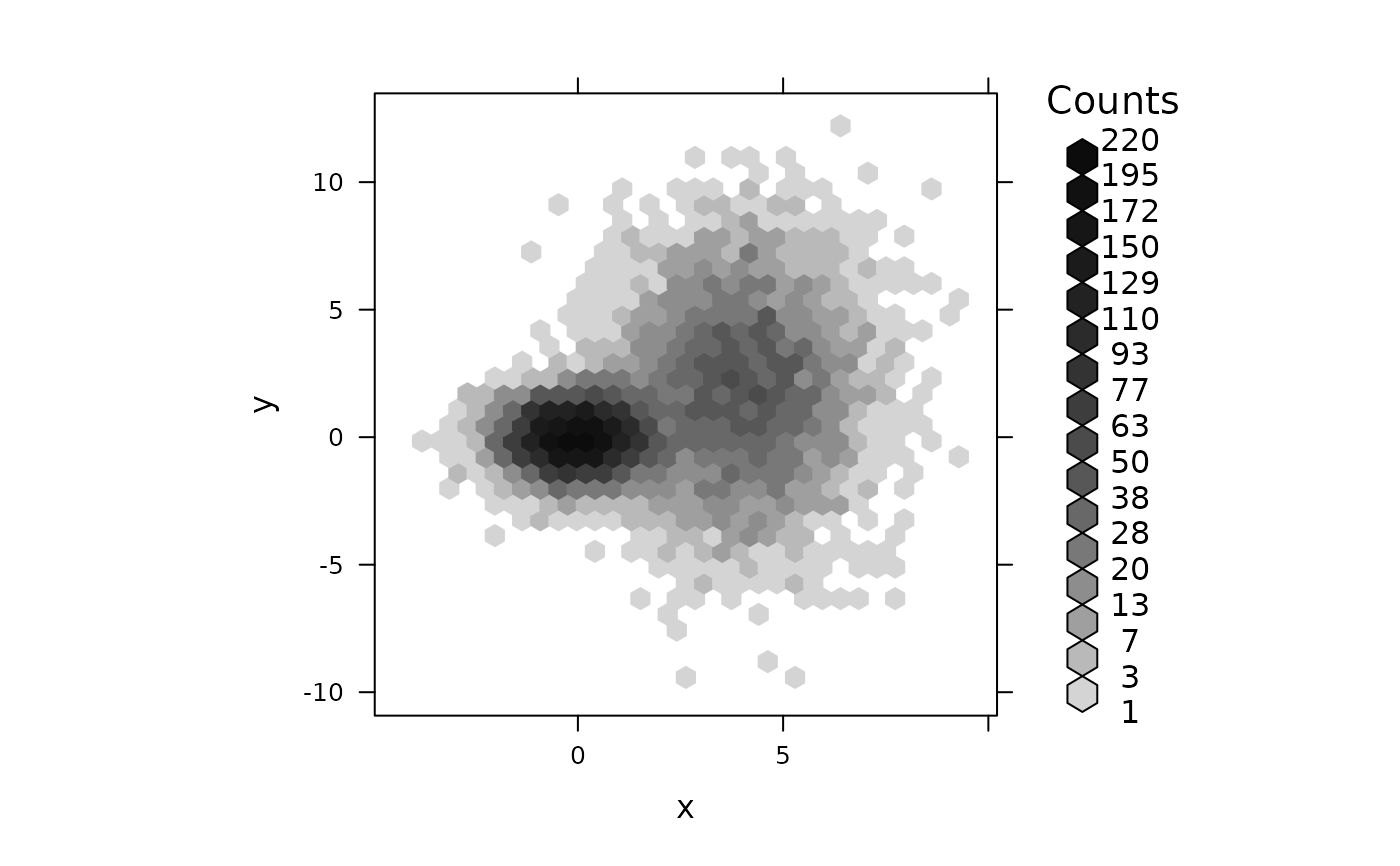
hexbinplot(y ~ x, mixdata, aspect = 1,
trans = sqrt, inv = function(x) x^2)
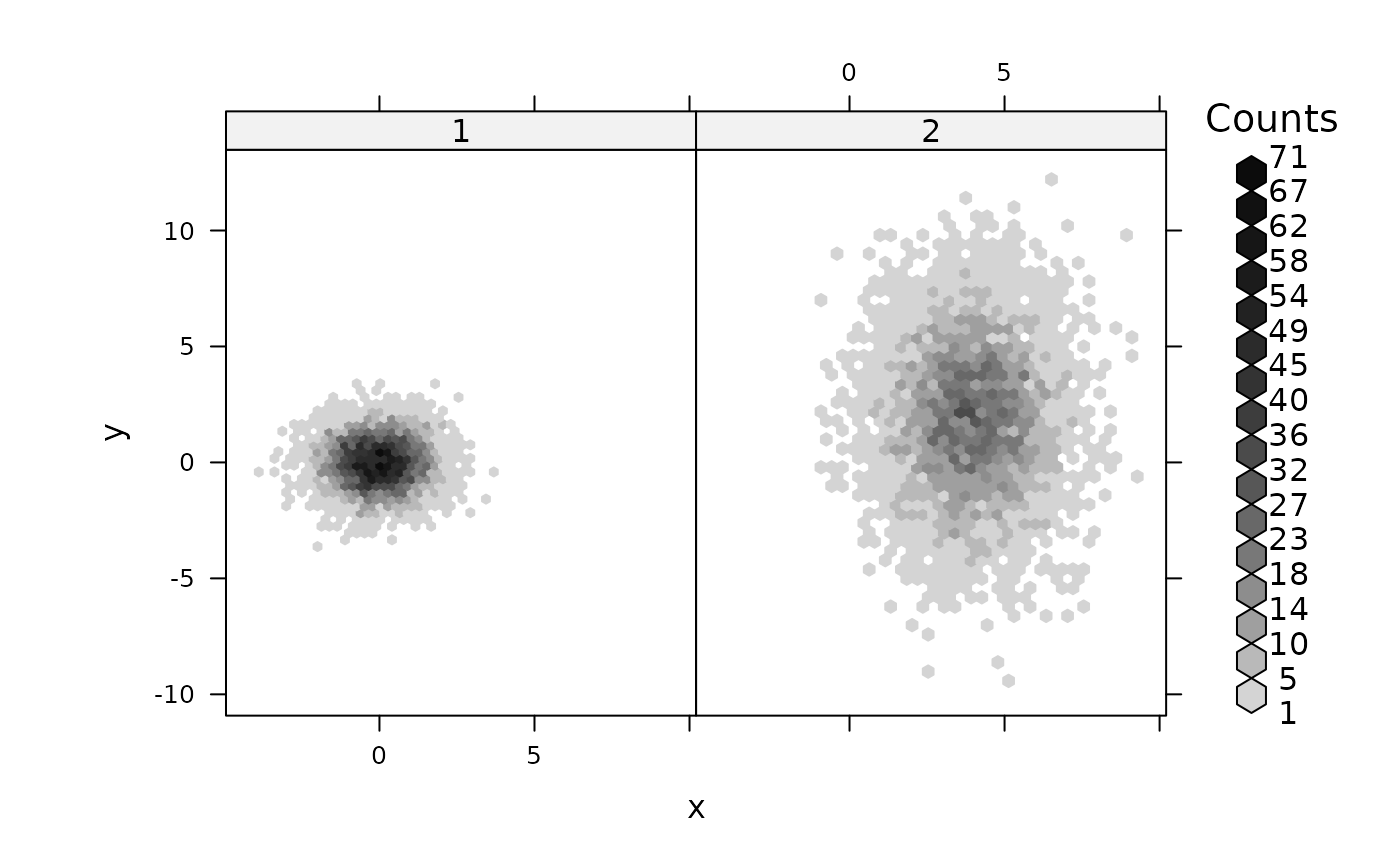
 hexbinplot(y ~ x | a, mixdata)
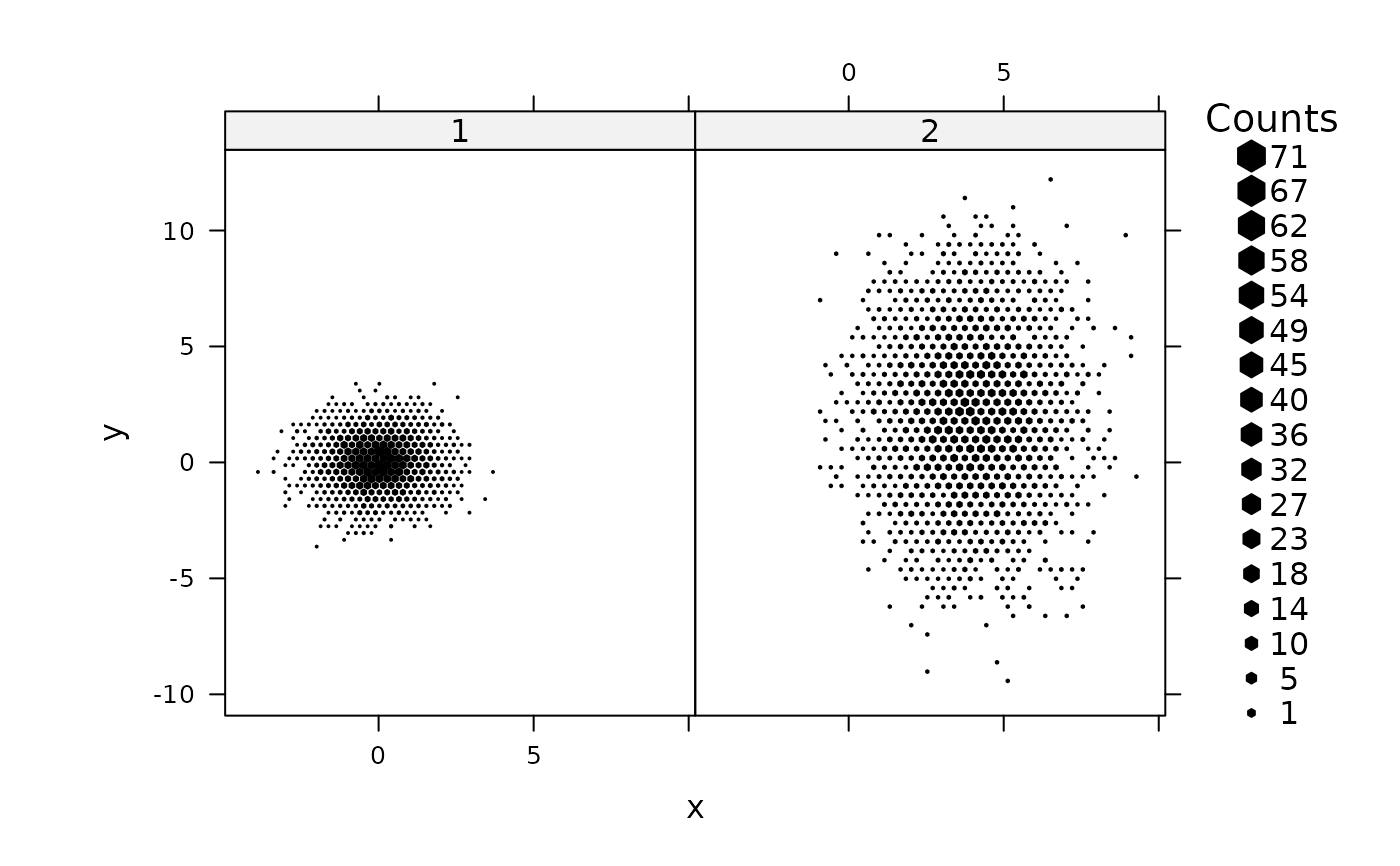
 hexbinplot(y ~ x | a, mixdata, style = "lattice",
xbnds = "data", ybnds = "data")
#> Warning: legend shows relative sizes
hexbinplot(y ~ x | a, mixdata, style = "lattice",
xbnds = "data", ybnds = "data")
#> Warning: legend shows relative sizes
 hexbinplot(y ~ x | a, mixdata, style = "nested.centroids")
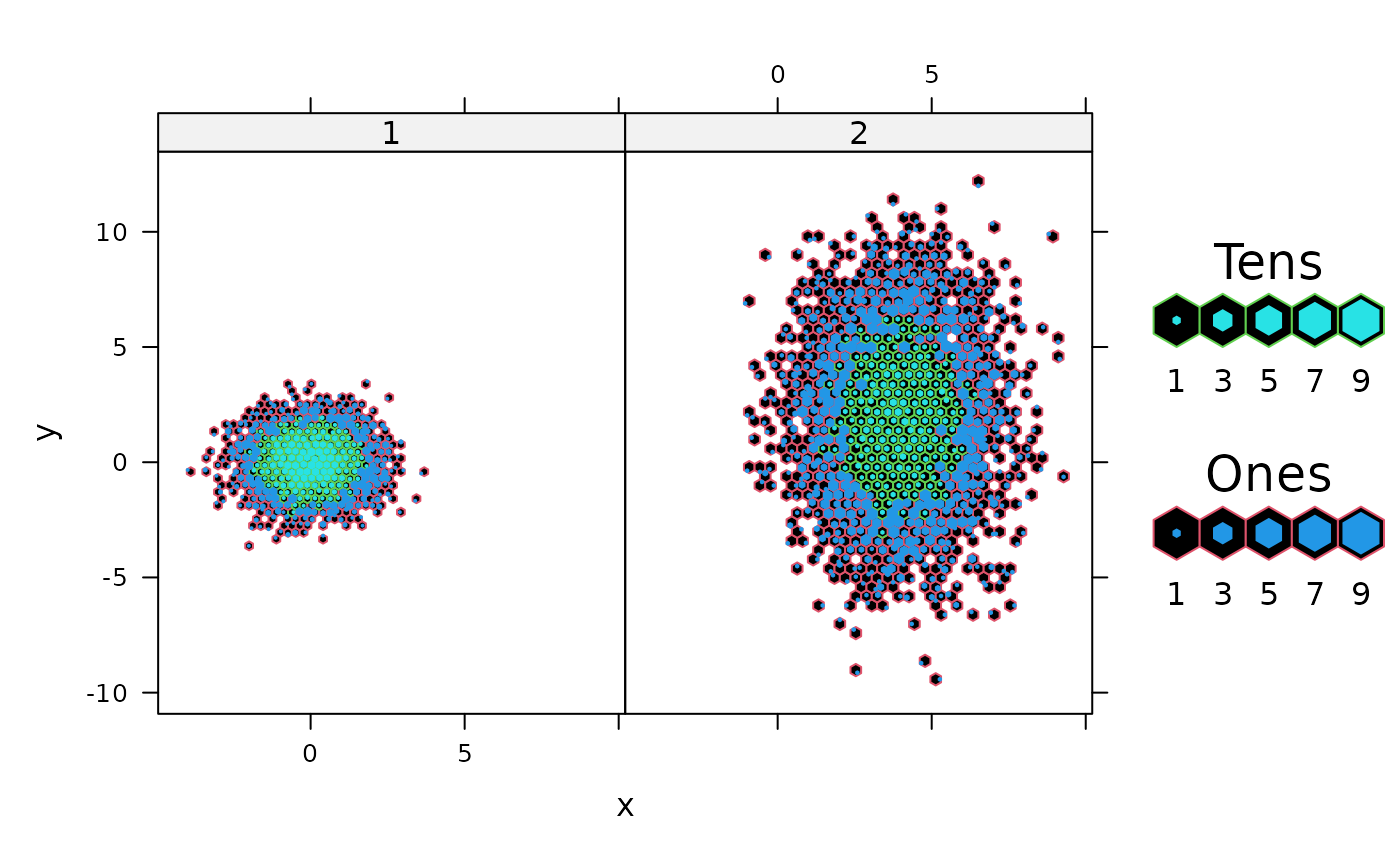 hexbinplot(y ~ x | a, mixdata, style = "nested.centroids",
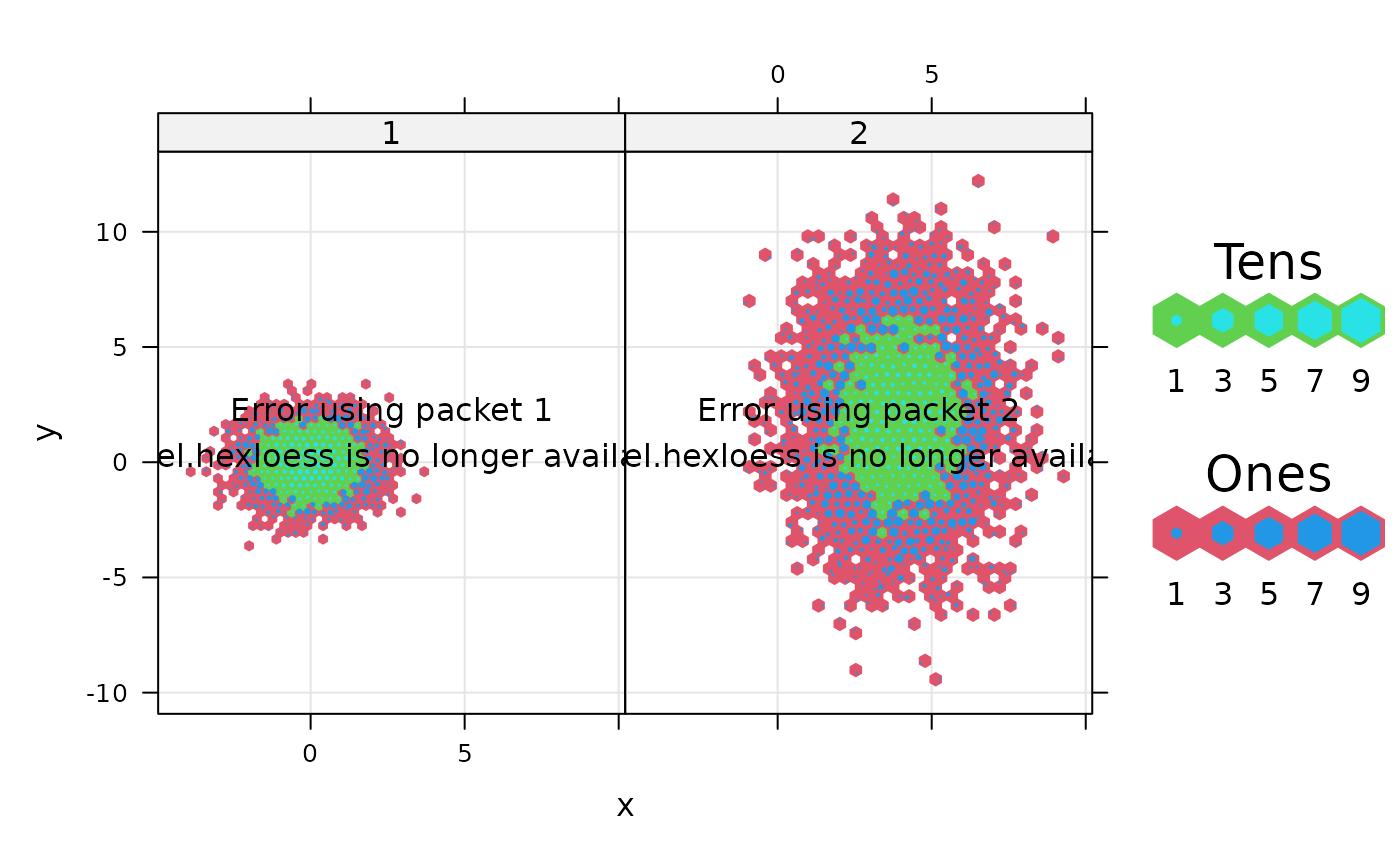
border = FALSE, type = c("g", "smooth"))
hexbinplot(y ~ x | a, mixdata, style = "nested.centroids",
border = FALSE, type = c("g", "smooth"))