2-D Generalization of Boxplot
hboxplot.RdIf bin is an eroded hexbin object, i.e.,
an erodebin object, hboxplot() plots the high counts cells
selected by erode(). By default, the high counts
cells contain 50 percent of the counts so analagous to the
interquartile “range”. The function distinguishes the last
cells eroded using color. These cells correspond to one definition of the
bivariate median.
Arguments
- bin
an object of class
hexbin.- xbnds,ybnds
global x- and y-axis plotting limits for multiple plots.
- density, border
arguments for
polygon()each of length two, the first for the median, the second for the other cells.- pen
colors (“pen numbers”) for
polygon().- unzoom
plot limit expansion factor when
xbndsis missing.- clip
either 'on' or 'off' are the allowed arguments, when on everything is clipped to the plotting region.
- reshape
logical value to reshape the plot although
xbndsandybndsare present.- xlab, ylab, main
x- and y- axis labels and main title
Value
invisibly, the hexViewport() used internally.
Used to add to the plot afterwards.
References
see in grid.hexagons.
Details
The density, border, and pen arguments correspond
to the polygon function calls for plotting two types of
cells. The cell types, pen numbers and suggested colors are
| TYPE | PEN | COLOR |
| cells of bin | 2 | light gray |
| last eroded cells of bin (median cells) | 1 | black |
The erode components of the hexbin objects must be present for the medians cells to plot.
When xbnds is missing or reshape is true, the plot
changes graphics parameters and resets them. When xbnds is
missing the function also zooms in based on the available data to
provide increased resolution.
The zoom used the hexagon cell centers. The unzoom argument backs off a bit so the whole hexagon will fit in the plot.
Hboxplot() is used as a stand alone function, for producing separate
legends .....
Examples
## boxplot of smoothed counts
x <- rnorm(10000)
y <- rnorm(10000)
bin <- hexbin(x,y)
erodebin <- erode(smooth.hexbin(bin))
hboxplot(erodebin)
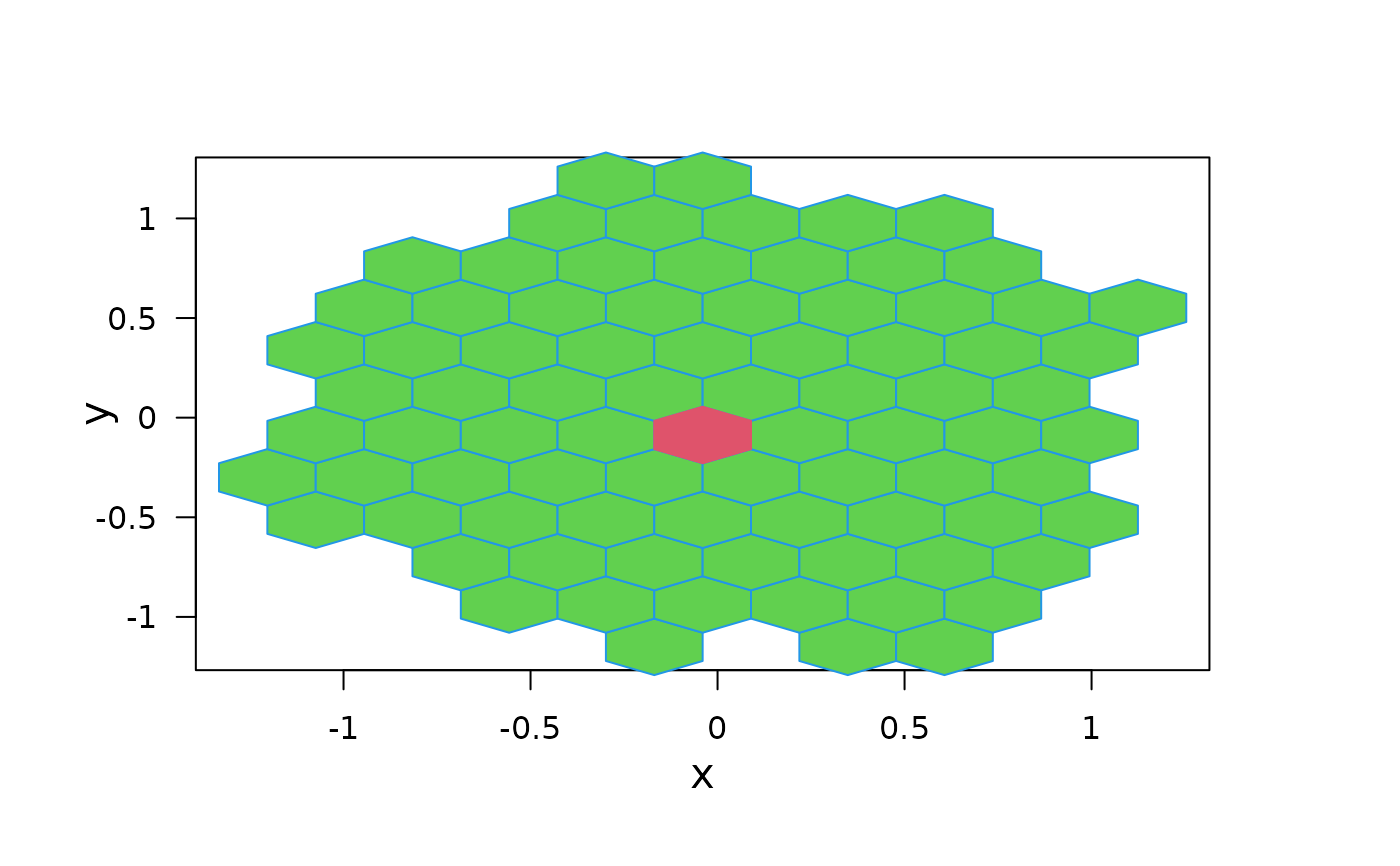
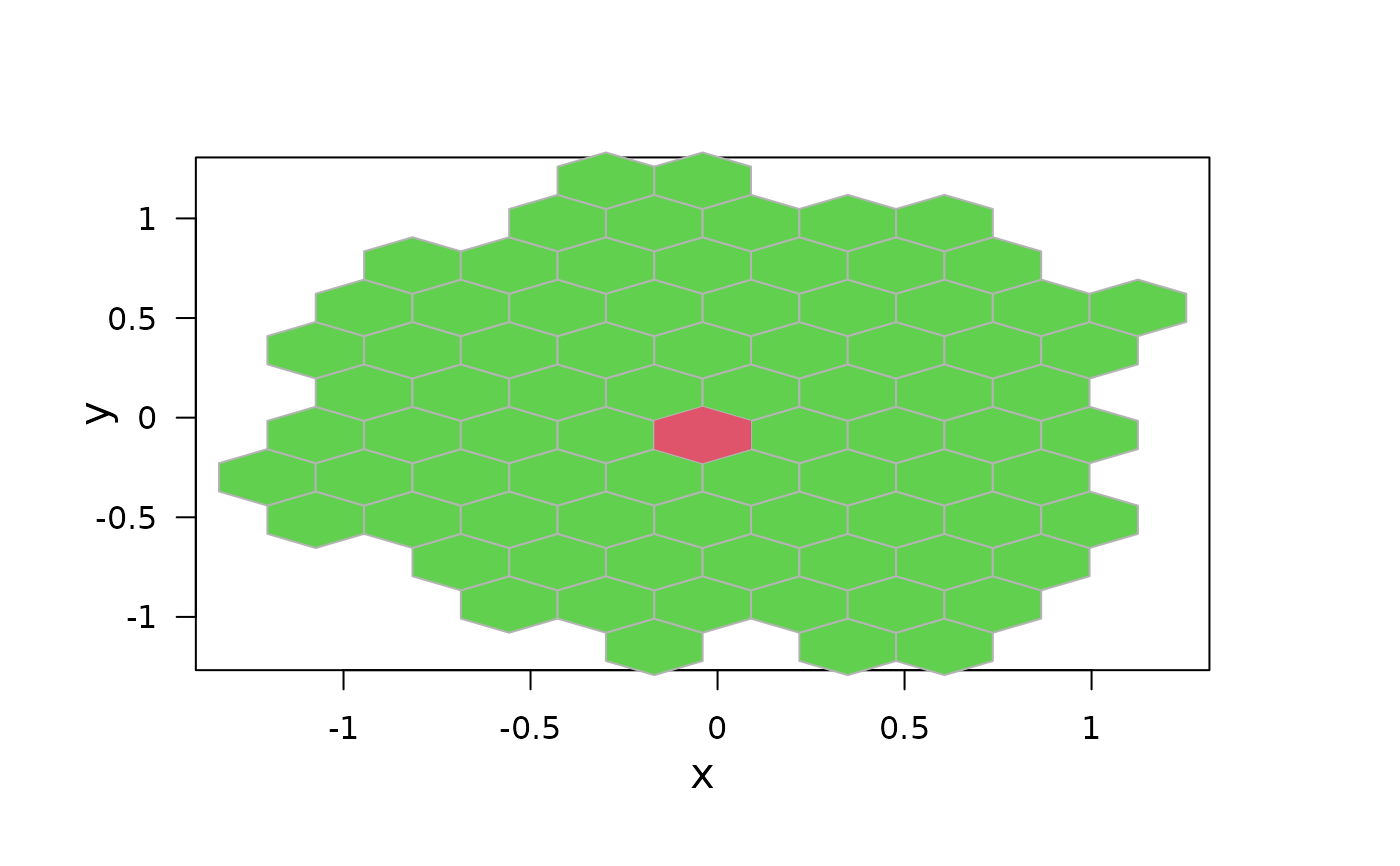 hboxplot(erodebin, density = c(32,7), border = c(2,4))
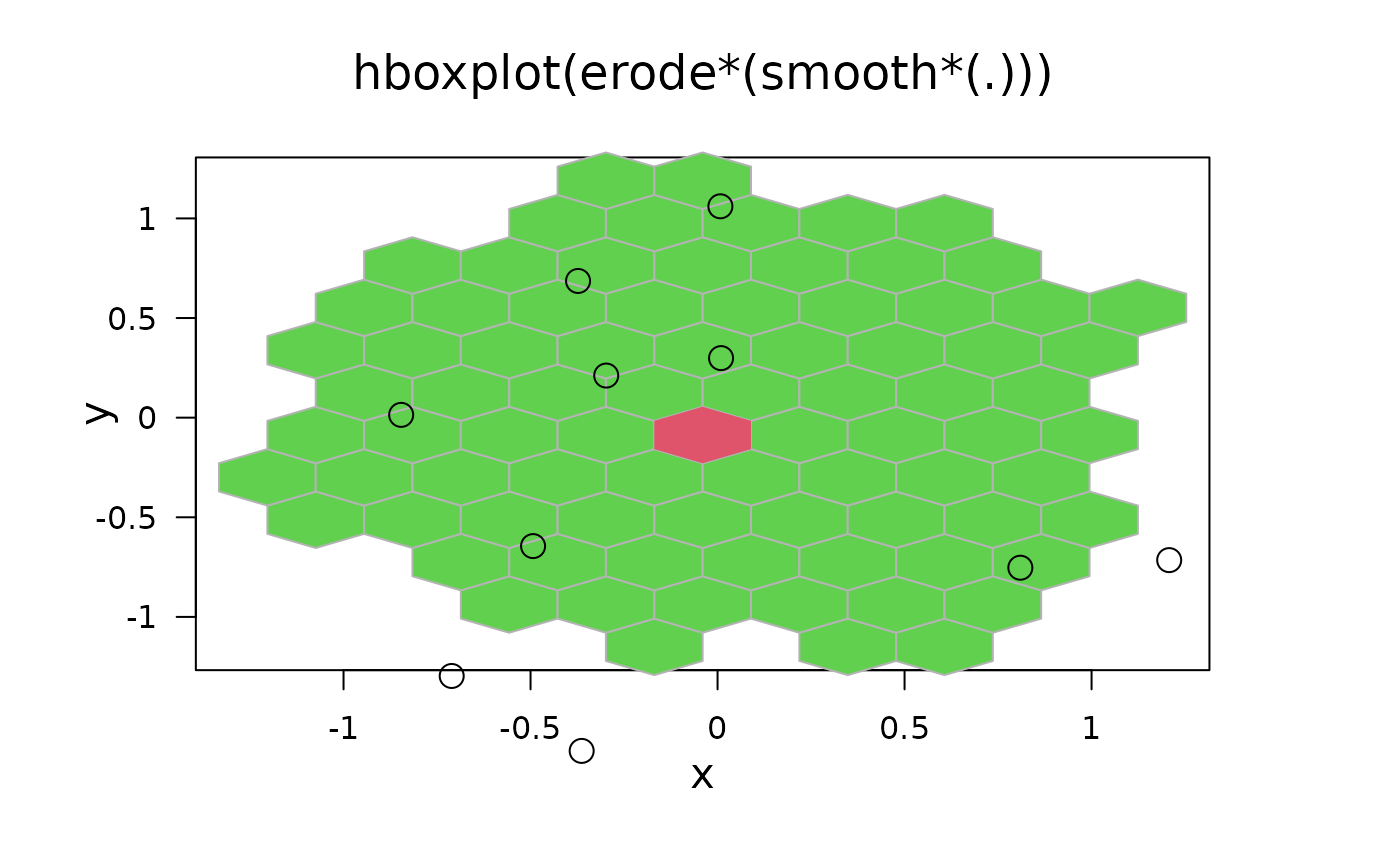
 hp <- hboxplot(erodebin, density = c(-1,17),
main = "hboxplot(erode*(smooth*(.)))")
pushHexport(hp)
library("grid")
grid.points(x[1:10], y[1:10])# just non-sense to show the principle
popViewport()
hp <- hboxplot(erodebin, density = c(-1,17),
main = "hboxplot(erode*(smooth*(.)))")
pushHexport(hp)
library("grid")
grid.points(x[1:10], y[1:10])# just non-sense to show the principle
popViewport()