Applies a function over subsets of the vector(s) formed by taking a fixed number of previous points.
Arguments
- X
data vector
- Y
data vector (optional)
- fun
Function to apply. Default is
mean- width
Integer giving the number of vector elements to include in the subsets. Defaults to the lesser of the length of the data and 20 elements.
- allow.fewer
Boolean indicating whether the function should be computed for subsets with fewer than
widthpoints- pad
Boolean indicating whether the returned results should be 'padded' with NAs corresponding to sets with less than
widthelements. This only applies when whenallow.feweris FALSE.- align
One of "right", "center", or "left". This controls the relative location of `short' subsets with less then
widthelements: "right" allows short subsets only at the beginning of the sequence so that all of the complete subsets are at the end of the sequence (i.e. `right aligned'), "left" allows short subsets only at the end of the data so that the complete subsets are `left aligned', and "center" allows short subsets at both ends of the data so that complete subsets are `centered'.- simplify
Boolean. If FALSE the returned object will be a list containing one element per evaluation. If TRUE, the returned object will be coerced into a vector (if the computation returns a scalar) or a matrix (if the computation returns multiple values). Defaults to FALSE.
- by
Integer separation between groups. If
by=widthwill give non-overlapping windows. Default is missing, in which case groups will start at each value in the X/Y range.- ...
parameters to be passed to
fun
Value
List (if simplify==TRUE), vector, or matrix containing the
results of applying the function fun to the subsets of X
(running) or X and Y.
Note that this function will create a vector or matrix even for objects
which are not simplified by sapply.
Details
running applies the specified function to a sequential windows on
X and (optionally) Y. If Y is specified the function
must be bivariate.
Examples
# show effect of pad
running(1:20, width = 5)
#> 1:5 2:6 3:7 4:8 5:9 6:10 7:11 8:12 9:13 10:14 11:15 12:16 13:17
#> 3 4 5 6 7 8 9 10 11 12 13 14 15
#> 14:18 15:19 16:20
#> 16 17 18
running(1:20, width = 5, pad = TRUE)
#> 1:1 1:2 1:3 1:4 1:5 2:6 3:7 4:8 5:9 6:10 7:11 8:12 9:13
#> NA NA NA NA 3 4 5 6 7 8 9 10 11
#> 10:14 11:15 12:16 13:17 14:18 15:19 16:20
#> 12 13 14 15 16 17 18
# show effect of align
running(1:20, width = 5, align = "left", pad = TRUE)
#> 1:5 2:6 3:7 4:8 5:9 6:10 7:11 8:12 9:13 10:14 11:15 12:16 13:17
#> 3 4 5 6 7 8 9 10 11 12 13 14 15
#> 14:18 15:19 16:20 17:20 18:20 19:20 20:20
#> 16 17 18 NA NA NA NA
running(1:20, width = 5, align = "center", pad = TRUE)
#> 1:1 1:2 1:3 1:4 1:5 2:6 3:7 4:8 5:9 6:10 7:11 8:12 9:13
#> NA NA NA NA 3 4 5 6 7 8 9 10 11
#> 10:14 11:15 12:16 13:17 14:18 15:19 16:20 17:20 18:20 19:20 20:20
#> 12 13 14 15 16 17 18 NA NA NA NA
running(1:20, width = 5, align = "right", pad = TRUE)
#> 1:1 1:2 1:3 1:4 1:5 2:6 3:7 4:8 5:9 6:10 7:11 8:12 9:13
#> NA NA NA NA 3 4 5 6 7 8 9 10 11
#> 10:14 11:15 12:16 13:17 14:18 15:19 16:20
#> 12 13 14 15 16 17 18
# show effect of simplify
running(1:20, width = 5, fun = function(x) x) # matrix
#> 1:5 2:6 3:7 4:8 5:9 6:10 7:11 8:12 9:13 10:14 11:15 12:16 13:17 14:18
#> [1,] 1 2 3 4 5 6 7 8 9 10 11 12 13 14
#> [2,] 2 3 4 5 6 7 8 9 10 11 12 13 14 15
#> [3,] 3 4 5 6 7 8 9 10 11 12 13 14 15 16
#> [4,] 4 5 6 7 8 9 10 11 12 13 14 15 16 17
#> [5,] 5 6 7 8 9 10 11 12 13 14 15 16 17 18
#> 15:19 16:20
#> [1,] 15 16
#> [2,] 16 17
#> [3,] 17 18
#> [4,] 18 19
#> [5,] 19 20
running(1:20, width = 5, fun = function(x) x, simplify = FALSE) # list
#> $`1:5`
#> [1] 1 2 3 4 5
#>
#> $`2:6`
#> [1] 2 3 4 5 6
#>
#> $`3:7`
#> [1] 3 4 5 6 7
#>
#> $`4:8`
#> [1] 4 5 6 7 8
#>
#> $`5:9`
#> [1] 5 6 7 8 9
#>
#> $`6:10`
#> [1] 6 7 8 9 10
#>
#> $`7:11`
#> [1] 7 8 9 10 11
#>
#> $`8:12`
#> [1] 8 9 10 11 12
#>
#> $`9:13`
#> [1] 9 10 11 12 13
#>
#> $`10:14`
#> [1] 10 11 12 13 14
#>
#> $`11:15`
#> [1] 11 12 13 14 15
#>
#> $`12:16`
#> [1] 12 13 14 15 16
#>
#> $`13:17`
#> [1] 13 14 15 16 17
#>
#> $`14:18`
#> [1] 14 15 16 17 18
#>
#> $`15:19`
#> [1] 15 16 17 18 19
#>
#> $`16:20`
#> [1] 16 17 18 19 20
#>
# show effect of by
running(1:20, width = 5) # normal
#> 1:5 2:6 3:7 4:8 5:9 6:10 7:11 8:12 9:13 10:14 11:15 12:16 13:17
#> 3 4 5 6 7 8 9 10 11 12 13 14 15
#> 14:18 15:19 16:20
#> 16 17 18
running(1:20, width = 5, by = 5) # non-overlapping
#> 1:5 6:10 11:15 16:20
#> 3 8 13 18
running(1:20, width = 5, by = 2) # starting every 2nd
#> 1:5 3:7 5:9 7:11 9:13 11:15 13:17 15:19
#> 3 5 7 9 11 13 15 17
# Use 'pad' to ensure correct length of vector, also show the effect
# of allow.fewer.
par(mfrow = c(2, 1))
plot(1:20, running(1:20, width = 5, allow.fewer = FALSE, pad = TRUE), type = "b")
plot(1:20, running(1:20, width = 5, allow.fewer = TRUE, pad = TRUE), type = "b")
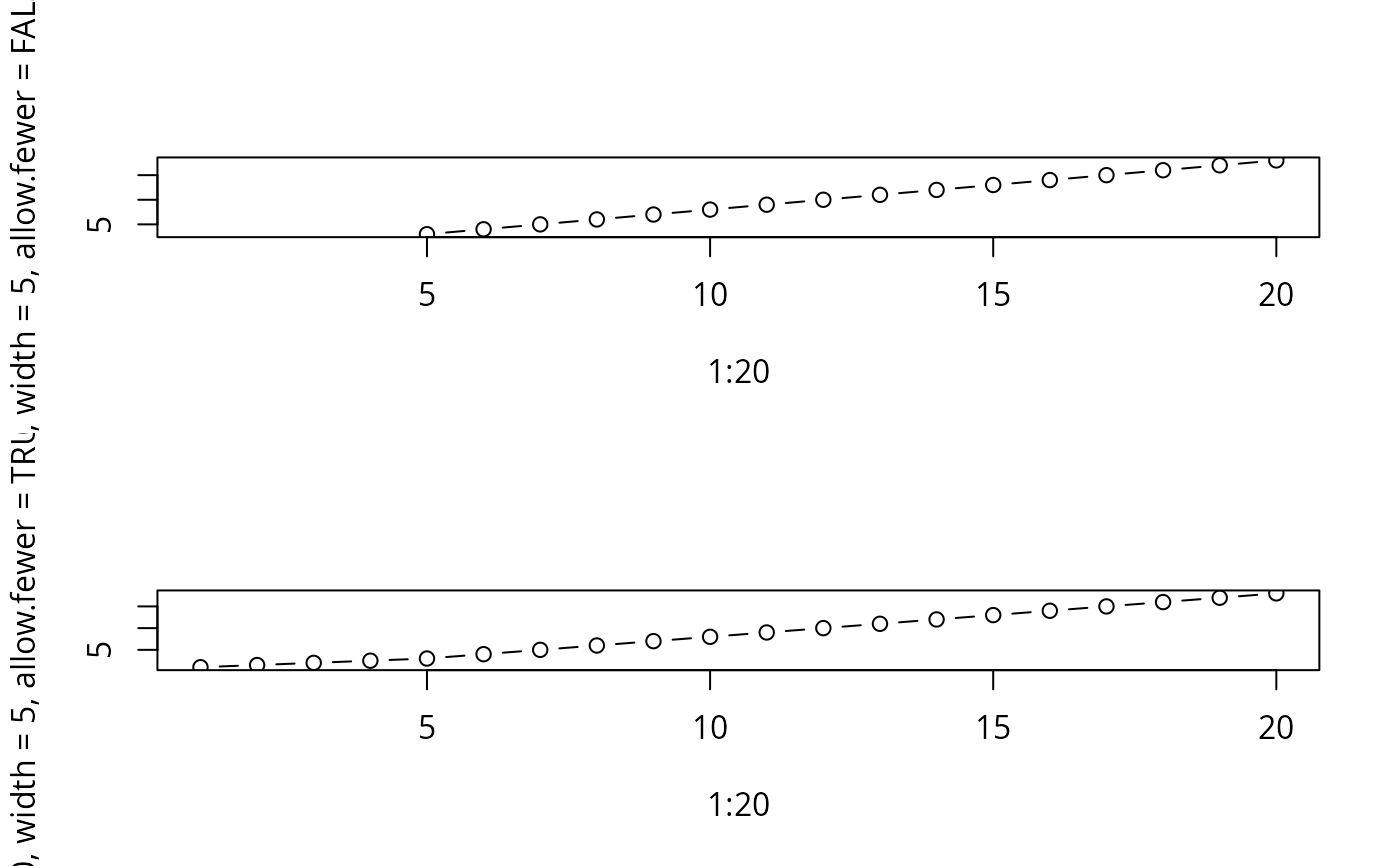 par(mfrow = c(1, 1))
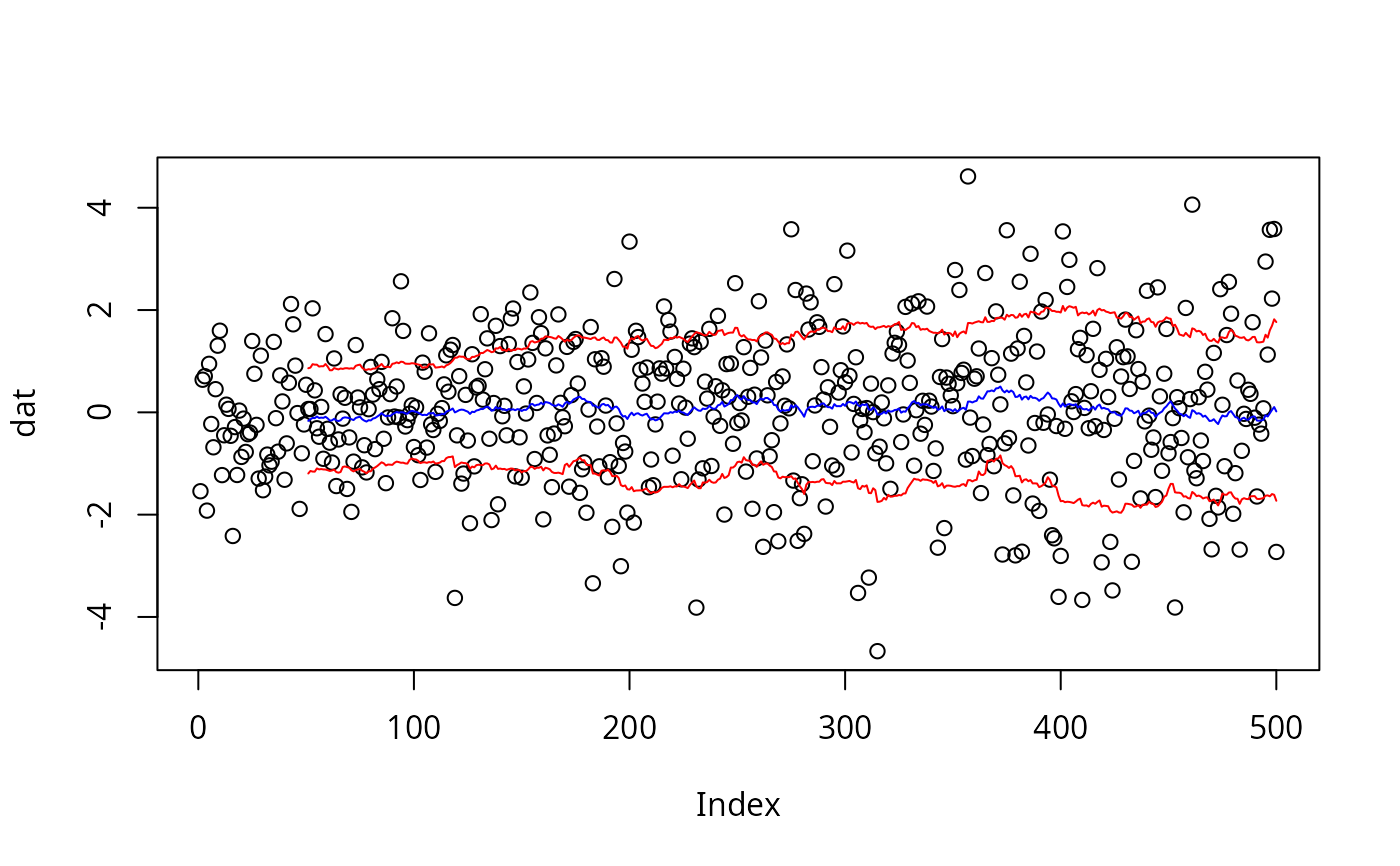
# plot running mean and central 2 standard deviation range
# estimated by *last* 40 observations
dat <- rnorm(500, sd = 1 + (1:500) / 500)
plot(dat)
sdfun <- function(x, sign = 1) mean(x) + sign * sqrt(var(x))
lines(running(dat, width = 51, pad = TRUE, fun = mean), col = "blue")
lines(running(dat, width = 51, pad = TRUE, fun = sdfun, sign = -1), col = "red")
lines(running(dat, width = 51, pad = TRUE, fun = sdfun, sign = 1), col = "red")
par(mfrow = c(1, 1))
# plot running mean and central 2 standard deviation range
# estimated by *last* 40 observations
dat <- rnorm(500, sd = 1 + (1:500) / 500)
plot(dat)
sdfun <- function(x, sign = 1) mean(x) + sign * sqrt(var(x))
lines(running(dat, width = 51, pad = TRUE, fun = mean), col = "blue")
lines(running(dat, width = 51, pad = TRUE, fun = sdfun, sign = -1), col = "red")
lines(running(dat, width = 51, pad = TRUE, fun = sdfun, sign = 1), col = "red")
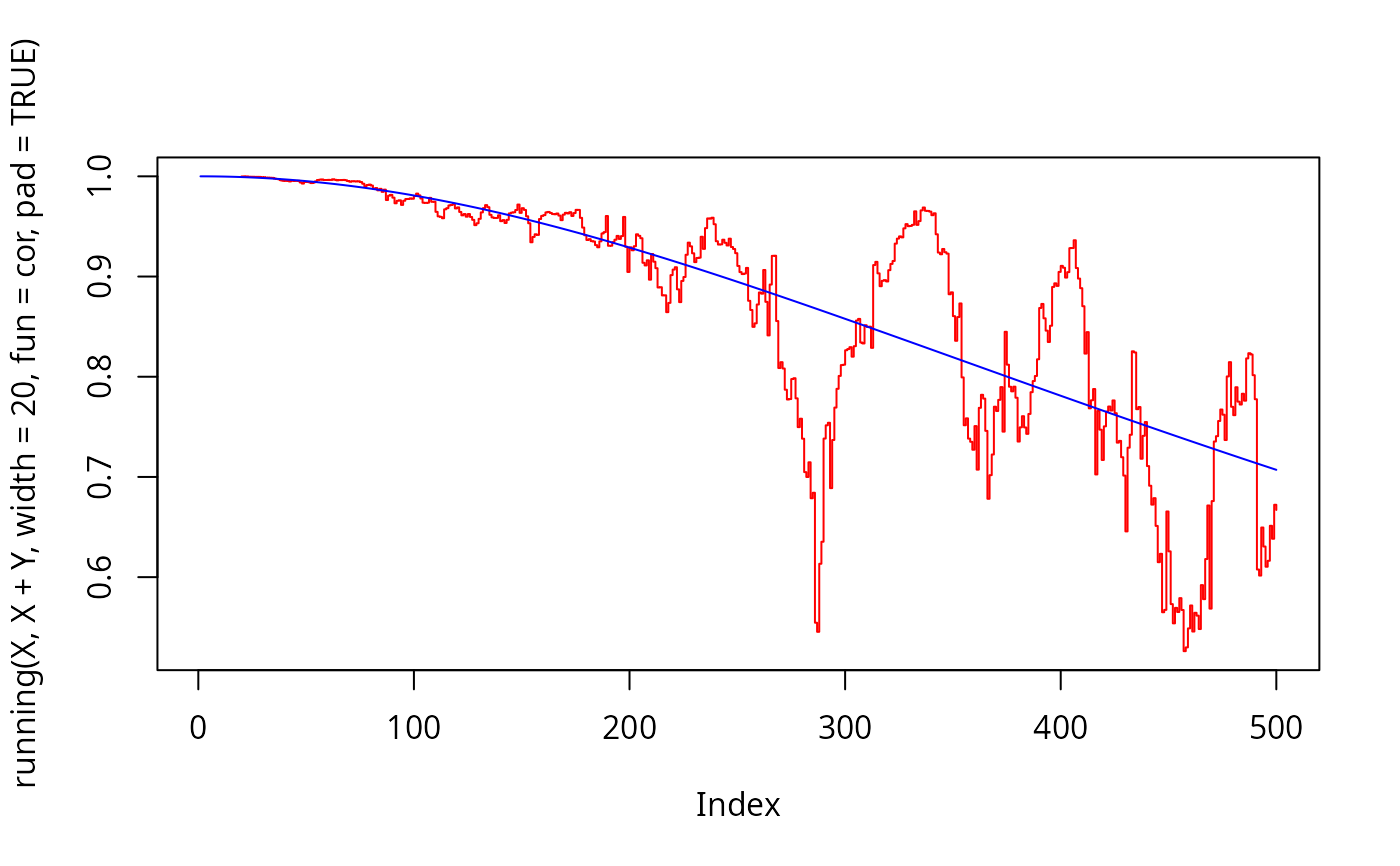
 # plot running correlation estimated by last 40 observations (red)
# against the true local correlation (blue)
sd.Y <- seq(0, 1, length = 500)
X <- rnorm(500, sd = 1)
Y <- rnorm(500, sd = sd.Y)
plot(running(X, X + Y, width = 20, fun = cor, pad = TRUE), col = "red", type = "s")
r <- 1 / sqrt(1 + sd.Y^2) # true cor of (X,X+Y)
lines(r, type = "l", col = "blue")
# plot running correlation estimated by last 40 observations (red)
# against the true local correlation (blue)
sd.Y <- seq(0, 1, length = 500)
X <- rnorm(500, sd = 1)
Y <- rnorm(500, sd = sd.Y)
plot(running(X, X + Y, width = 20, fun = cor, pad = TRUE), col = "red", type = "s")
r <- 1 / sqrt(1 + sd.Y^2) # true cor of (X,X+Y)
lines(r, type = "l", col = "blue")