Draw a textual table.
ggtexttable(): draw a textual table.ttheme(): customize table theme.rownames_style(), colnames_style(), tbody_style(): helper functions to customize the table row names, column names and body.table_cell_font(): access to a table cell for changing the text font (size and face).table_cell_bg(): access to a table cell for changing the background (fill, color, linewidth).tab_cell_crossout(): cross out a table cell.tab_ncol(), tab_nrow(): returns, respectively, the number of columns and rows in a ggtexttable.tab_add_hline(): Creates horizontal lines or separators at the top or the bottom side of a given specified row.tab_add_vline(): Creates vertical lines or separators at the right or the left side of a given specified column.tab_add_border(), tbody_add_border(), thead_add_border(): Add borders to table; tbody is for table body and thead is for table head.tab_add_title(),tab_add_footnote(): Add title, subtitle and footnote to a table.
Usage
ggtexttable(
  x,
  rows = rownames(x),
  cols = colnames(x),
  vp = NULL,
  theme = ttheme(),
  ...
)

ttheme(
  base_style = "default",
  base_size = 11,
  base_colour = "black",
  padding = unit(c(4, 4), "mm"),
  colnames.style = colnames_style(size = base_size),
  rownames.style = rownames_style(size = base_size),
  tbody.style = tbody_style(size = base_size)
)

colnames_style(
  color = "black",
  face = "bold",
  size = 12,
  fill = "grey80",
  linewidth = 1,
  linecolor = "white",
  parse = FALSE,
  ...
)

rownames_style(
  color = "black",
  face = "italic",
  size = 12,
  fill = NA,
  linewidth = 1,
  linecolor = "white",
  parse = FALSE,
  ...
)

tbody_style(
  color = "black",
  face = "plain",
  size = 12,
  fill = c("grey95", "grey90"),
  linewidth = 1,
  linecolor = "white",
  parse = FALSE,
  ...
)

table_cell_font(tab, row, column, face = NULL, size = NULL, color = NULL)

table_cell_bg(
  tab,
  row,
  column,
  fill = NULL,
  color = NULL,
  linewidth = NULL,
  alpha = NULL
)

tab_cell_crossout(
  tab,
  row,
  column,
  linetype = 1,
  linewidth = 1,
  linecolor = "black",
  reduce.size.by = 0
)

tab_ncol(tab)

tab_nrow(tab)

tab_add_hline(
  tab,
  at.row = 2:tab_nrow(tab),
  row.side = c("bottom", "top"),
  from.column = 1,
  to.column = tab_ncol(tab),
  linetype = 1,
  linewidth = 1,
  linecolor = "black"
)

tab_add_vline(
  tab,
  at.column = 2:tab_ncol(tab),
  column.side = c("left", "right"),
  from.row = 1,
  to.row = tab_nrow(tab),
  linetype = 1,
  linewidth = 1,
  linecolor = "black"
)

tab_add_border(
  tab,
  from.row = 2,
  to.row = tab_nrow(tab),
  from.column = 1,
  to.column = tab_ncol(tab),
  linetype = 1,
  linewidth = 1,
  linecolor = "black"
)

tbody_add_border(
  tab,
  from.row = 2,
  to.row = tab_nrow(tab),
  from.column = 1,
  to.column = tab_ncol(tab),
  linetype = 1,
  linewidth = 1,
  linecolor = "black"
)

thead_add_border(
  tab,
  from.row = 1,
  to.row = 1,
  from.column = 1,
  to.column = tab_ncol(tab),
  linetype = 1,
  linewidth = 1,
  linecolor = "black"
)

tab_add_title(
  tab,
  text,
  face = NULL,
  size = NULL,
  color = NULL,
  family = NULL,
  padding = unit(1.5, "line"),
  just = "left",
  hjust = NULL,
  vjust = NULL
)

tab_add_footnote(
  tab,
  text,
  face = NULL,
  size = NULL,
  color = NULL,
  family = NULL,
  padding = unit(1.5, "line"),
  just = "right",
  hjust = NULL,
  vjust = NULL
)
Arguments
- x
a
data.frameormatrix.- rows
optional vector to specify row names
- cols
optional vector to specify column names
- vp
optional viewport
- theme
a list, as returned by the function
ttheme(), defining the parameters of the table theme. Allowed values include one ofttheme()andttheme_clean().- ...
extra parameters for text justification, e.g.: hjust and x. Default is "centre" for the body and header, and "right" for the row names. Left justification:
hjust = 0, x = 0.1. Right justification:hjust = 1, x = 0.9.- base_style
character string the table style/theme. The available themes are illustrated in the ggtexttable-theme.pdf file. Allowed values include one of
c("default", "blank", "classic",
"minimal", "light", "lBlack", "lBlue", "lRed", "lGreen", "lViolet", "lCyan",
"lOrange", "lBlackWhite", "lBlueWhite", "lRedWhite", "lGreenWhite",
"lVioletWhite", "lCyanWhite", "lOrangeWhite", "mBlack", "mBlue", "mRed",
"mGreen", "mViolet", "mCyan", "mOrange", "mBlackWhite", "mBlueWhite",
"mRedWhite", "mGreenWhite", "mVioletWhite", "mCyanWhite", "mOrangeWhite" )
. Note that, l = "light"; m = "medium".- base_size
default font size
- base_colour
default font colour
- padding
length-2 unit vector specifying the horizontal and vertical padding of text within each cell
- colnames.style
a list, as returned by the function
colnames_style(), defining the style of the table column names. Considered only whenbase_size = "default".- rownames.style
a list, as returned by the function
rownames_style(), defining the style of the table row names. Considered only whenbase_size = "default".- tbody.style
a list, as returned by the function
tbody_style(), defining the style of the table body. Considered only whenbase_size = "default".- color, face, size
text font color, face and size, respectively. Allowed values for face include c("plain", "bold", "italic", "bold.italic").
- fill
background color.
- linewidth, linecolor
line width and color, respectively.
- parse
logical, default behaviour for parsing text as plotmath
- tab
an object from
ggtexttableor fromgridExtra::tableGrob().- row, column
an integer specifying the row and the column numbers for the cell of interest.
- alpha
numeric value specifying fill color transparency. Value should be in [0, 1], where 0 is full transparency and 1 is no transparency.
- linetype
line type
- reduce.size.by
Numeric value in [0, 1] to reduce the size by.
- at.row
a numeric vector of row indexes; for example
at.row = c(1, 2).- row.side
row side to which the horinzotal line should be added. Can be one of
c("bottom", "top").- from.column
integer indicating the column from which to start drawing the horizontal line.
- to.column
integer indicating the column to which the horizontal line should end.
- at.column
a numeric vector of column indexes; for example
at.column = c(1, 2).- column.side
column side to which the vertical line should be added. Can be one of
c("left", "right").- from.row
integer indicating the row from which to start drawing the horizontal line.
- to.row
integer indicating the row to which the vertical line should end.
- text
text to be added as title or footnote.
- family
font family
- just
The justification of the text relative to its (x, y) location. If there are two values, the first value specifies horizontal justification and the second value specifies vertical justification. Possible string values are: "left", "right", "centre", "center", "bottom", and "top". For numeric values, 0 means left (bottom) alignment and 1 means right (top) alignment.
- hjust
A numeric vector specifying horizontal justification. If specified, overrides the just setting.
- vjust
A numeric vector specifying vertical justification. If specified, overrides the just setting.
Examples
# data
df <- head(iris)
# Default table
# Remove row names using rows = NULL
ggtexttable(df, rows = NULL)
 # Text justification for individual cells/rows/columns (#335)
# First column is left justified i.e., hjust = 0 , x = 0.1
# Remaining columns are right justified i.e., hjust = 1 , x = 0.9
table_theme <- ttheme(
tbody.style = tbody_style(
hjust = as.vector(matrix(c(0, 1, 1, 1, 1), ncol = 5, nrow = nrow(df), byrow = TRUE)),
x = as.vector(matrix(c(.1, .9, .9,.9, .9), ncol = 5, nrow = nrow(df), byrow = TRUE))
)
)
ggtexttable(df, rows = NULL, theme = table_theme)
# Text justification for individual cells/rows/columns (#335)
# First column is left justified i.e., hjust = 0 , x = 0.1
# Remaining columns are right justified i.e., hjust = 1 , x = 0.9
table_theme <- ttheme(
tbody.style = tbody_style(
hjust = as.vector(matrix(c(0, 1, 1, 1, 1), ncol = 5, nrow = nrow(df), byrow = TRUE)),
x = as.vector(matrix(c(.1, .9, .9,.9, .9), ncol = 5, nrow = nrow(df), byrow = TRUE))
)
)
ggtexttable(df, rows = NULL, theme = table_theme)
 # Blank theme
ggtexttable(df, rows = NULL, theme = ttheme("blank"))
# Blank theme
ggtexttable(df, rows = NULL, theme = ttheme("blank"))
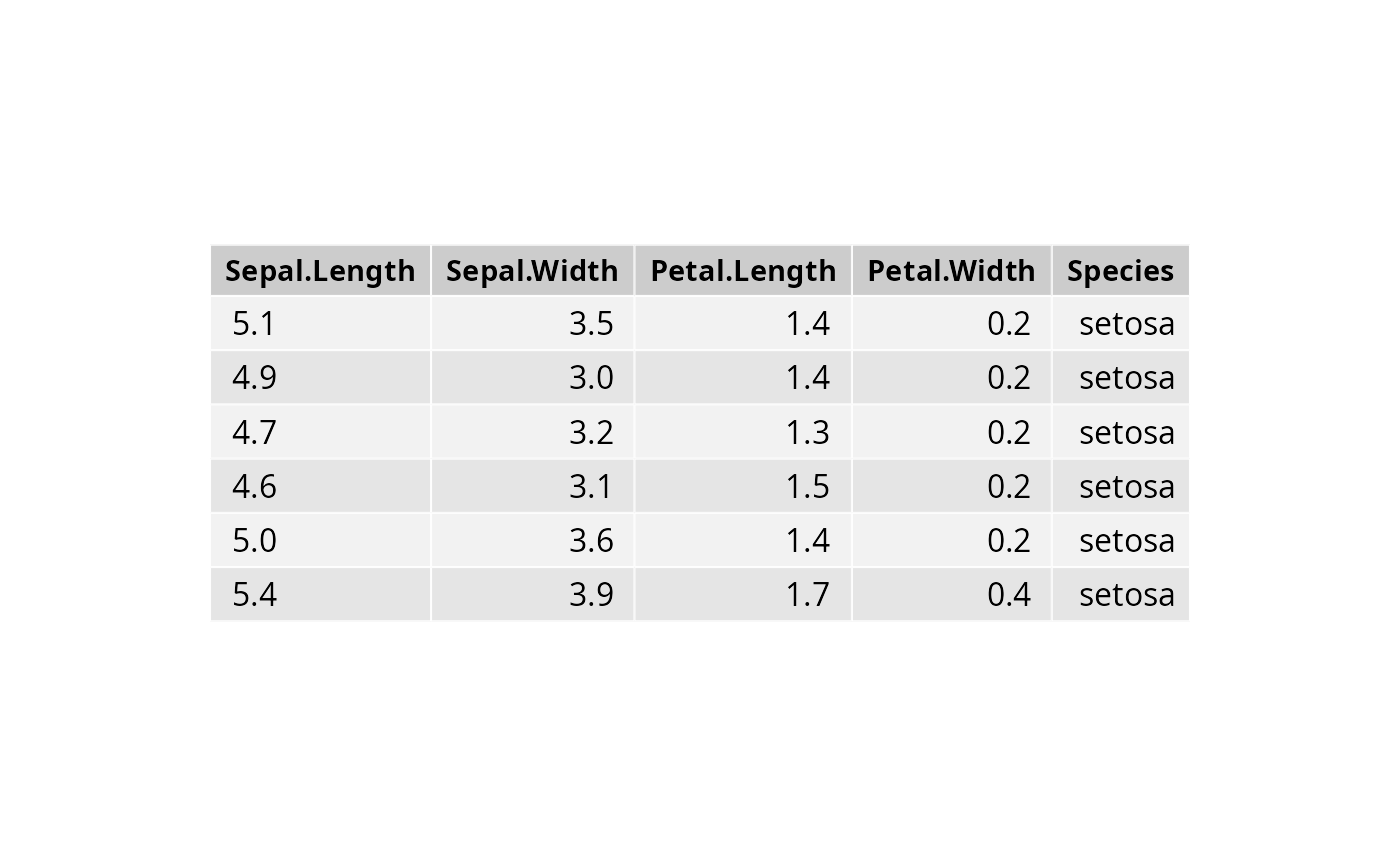
 # light theme
ggtexttable(df, rows = NULL, theme = ttheme("light"))
# light theme
ggtexttable(df, rows = NULL, theme = ttheme("light"))
 # Column names border only
ggtexttable(df, rows = NULL, theme = ttheme("blank")) %>%
tab_add_hline(at.row = 1:2, row.side = "top", linewidth = 2)
# Column names border only
ggtexttable(df, rows = NULL, theme = ttheme("blank")) %>%
tab_add_hline(at.row = 1:2, row.side = "top", linewidth = 2)
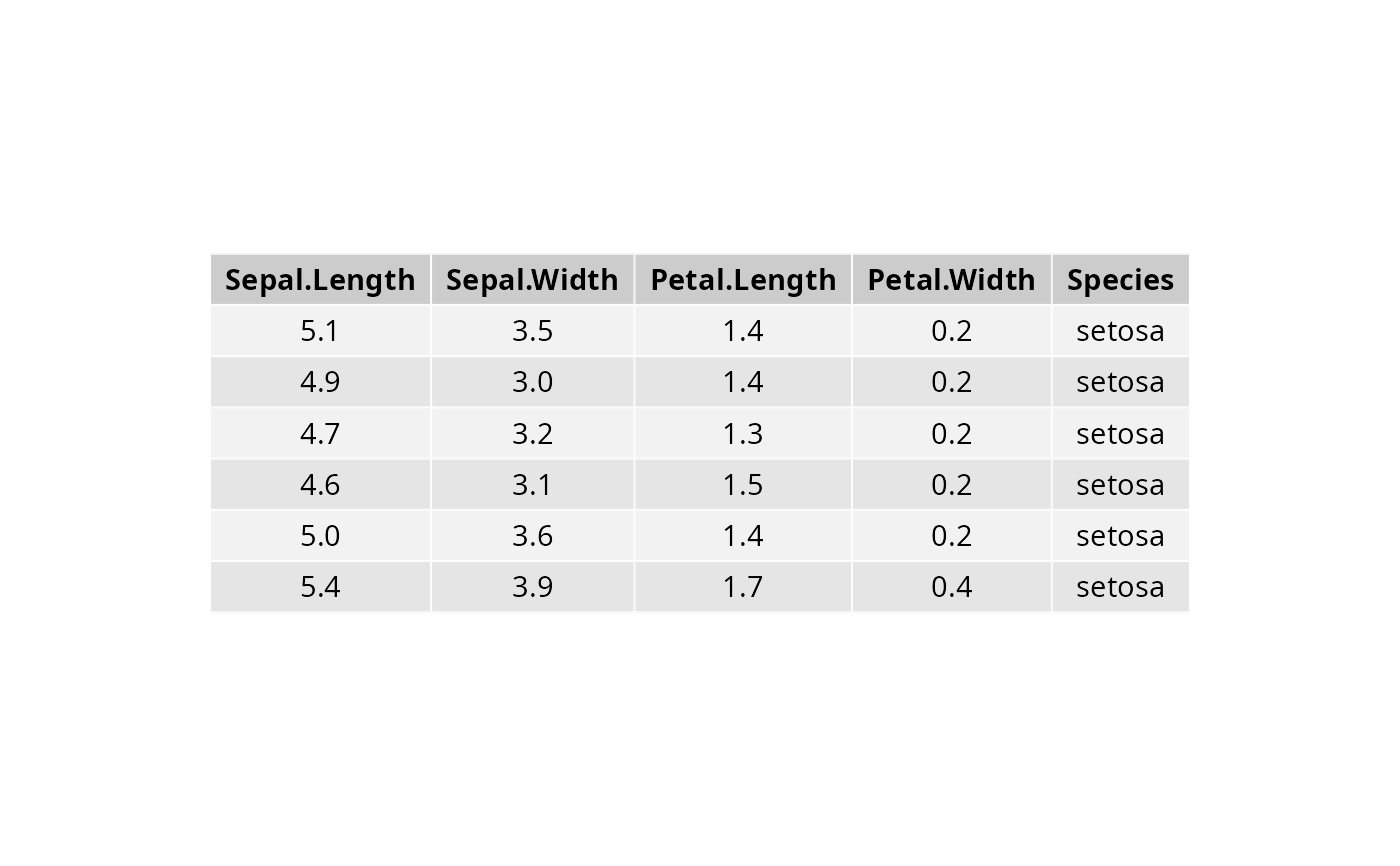
 # classic theme
ggtexttable(df, rows = NULL, theme = ttheme("classic"))
# classic theme
ggtexttable(df, rows = NULL, theme = ttheme("classic"))
 # minimal theme
ggtexttable(df, rows = NULL, theme = ttheme("minimal"))
# minimal theme
ggtexttable(df, rows = NULL, theme = ttheme("minimal"))
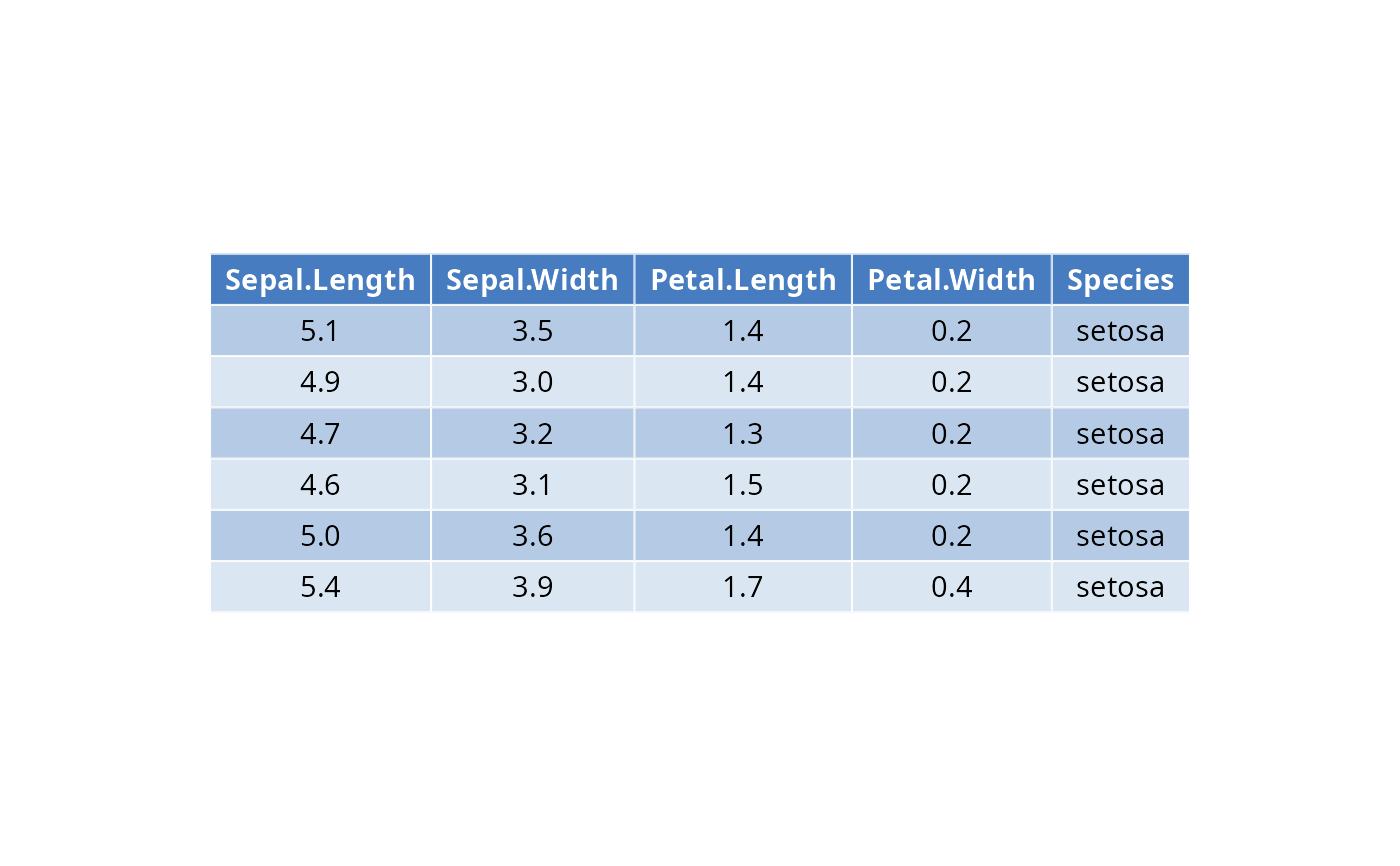
 # Medium blue (mBlue) theme
ggtexttable(df, rows = NULL, theme = ttheme("mBlue"))
# Medium blue (mBlue) theme
ggtexttable(df, rows = NULL, theme = ttheme("mBlue"))
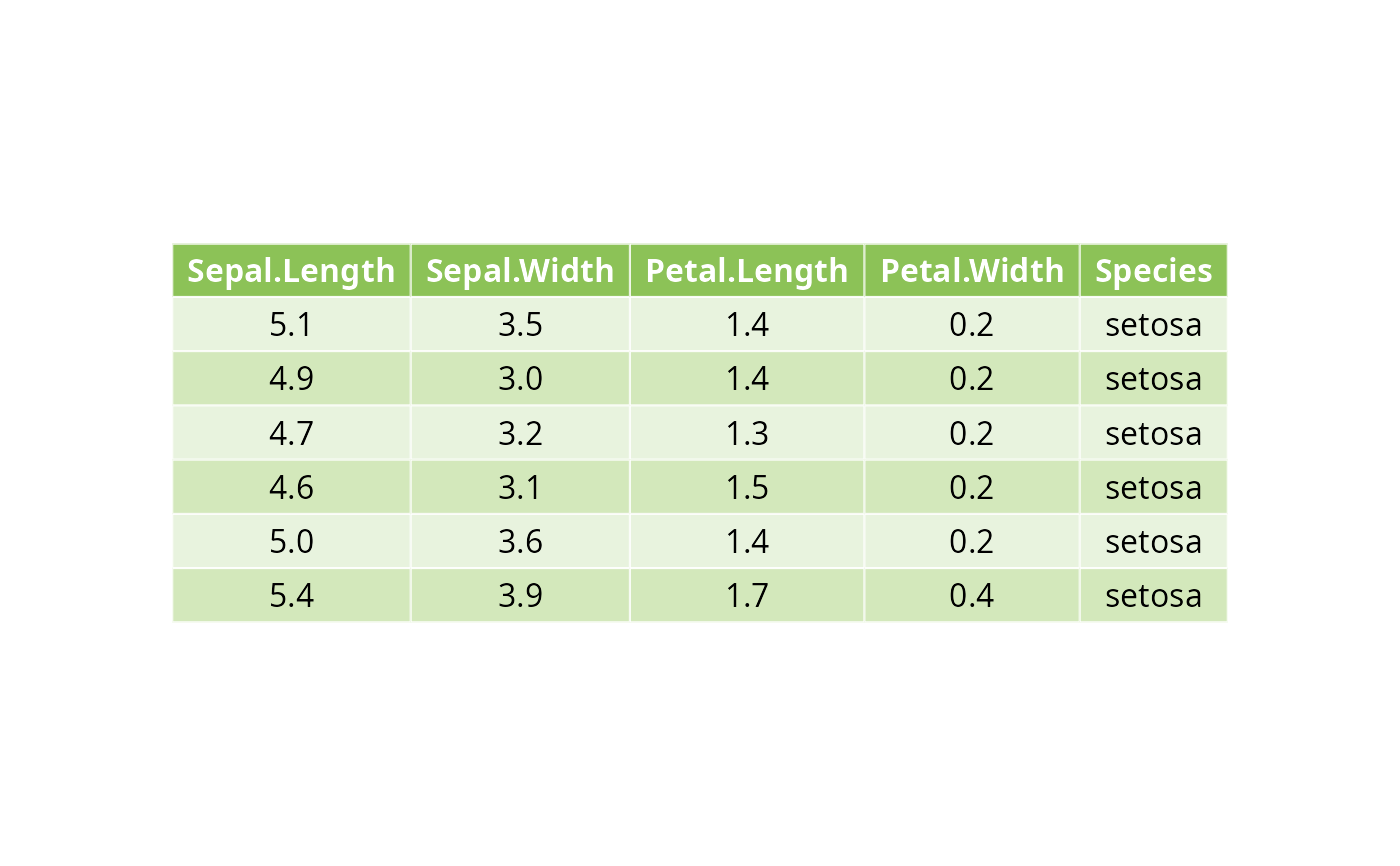
 # Customize the table as you want
ggtexttable(df, rows = NULL,
theme = ttheme(
colnames.style = colnames_style(color = "white", fill = "#8cc257"),
tbody.style = tbody_style(color = "black", fill = c("#e8f3de", "#d3e8bb"))
)
)
# Customize the table as you want
ggtexttable(df, rows = NULL,
theme = ttheme(
colnames.style = colnames_style(color = "white", fill = "#8cc257"),
tbody.style = tbody_style(color = "black", fill = c("#e8f3de", "#d3e8bb"))
)
)
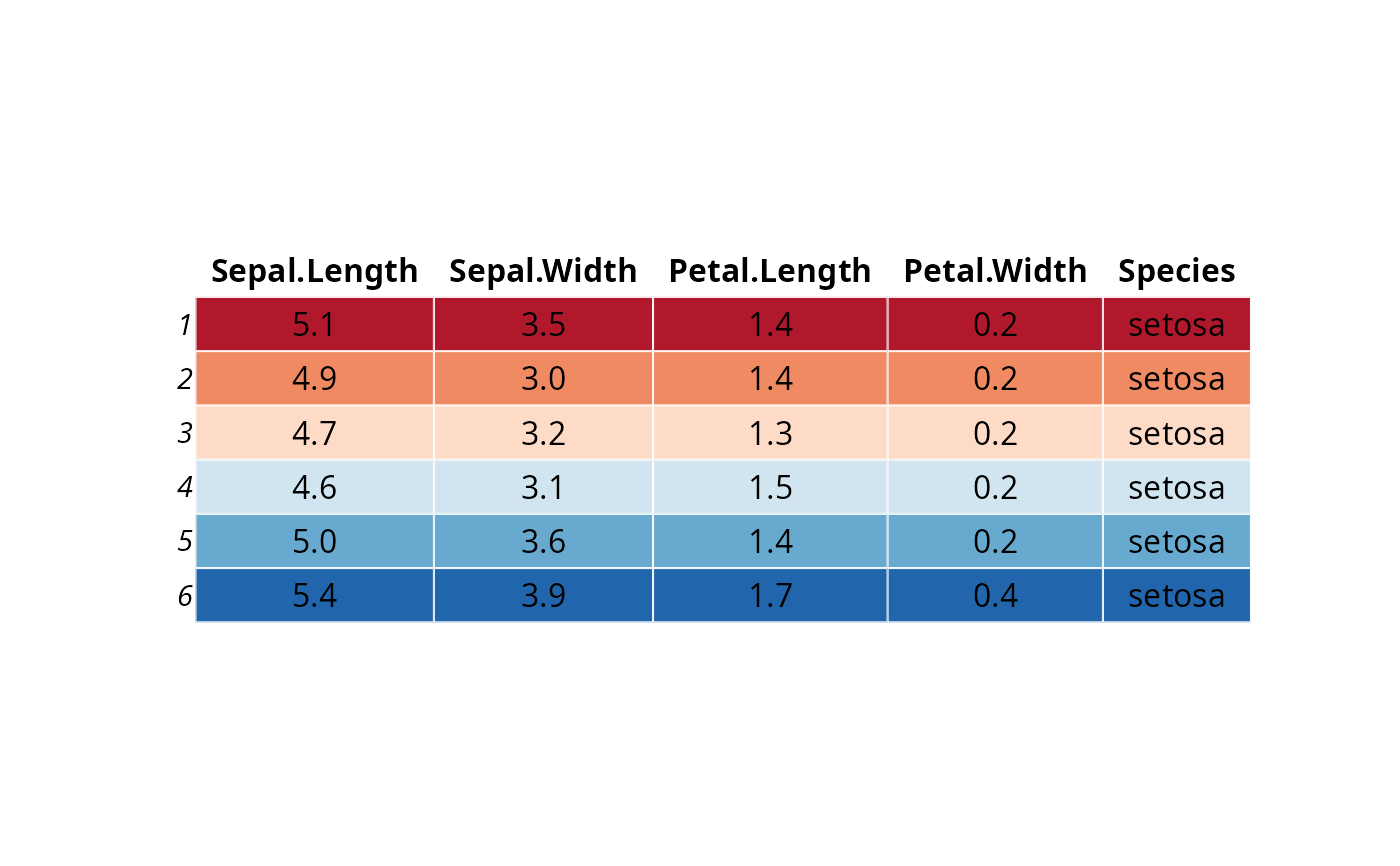
 # Use RColorBrewer palette
# Provide as many fill color as there are rows in the table body, here nrow = 6
ggtexttable(df,
theme = ttheme(
colnames.style = colnames_style(fill = "white"),
tbody.style = tbody_style(fill = get_palette("RdBu", 6))
)
)
# Use RColorBrewer palette
# Provide as many fill color as there are rows in the table body, here nrow = 6
ggtexttable(df,
theme = ttheme(
colnames.style = colnames_style(fill = "white"),
tbody.style = tbody_style(fill = get_palette("RdBu", 6))
)
)
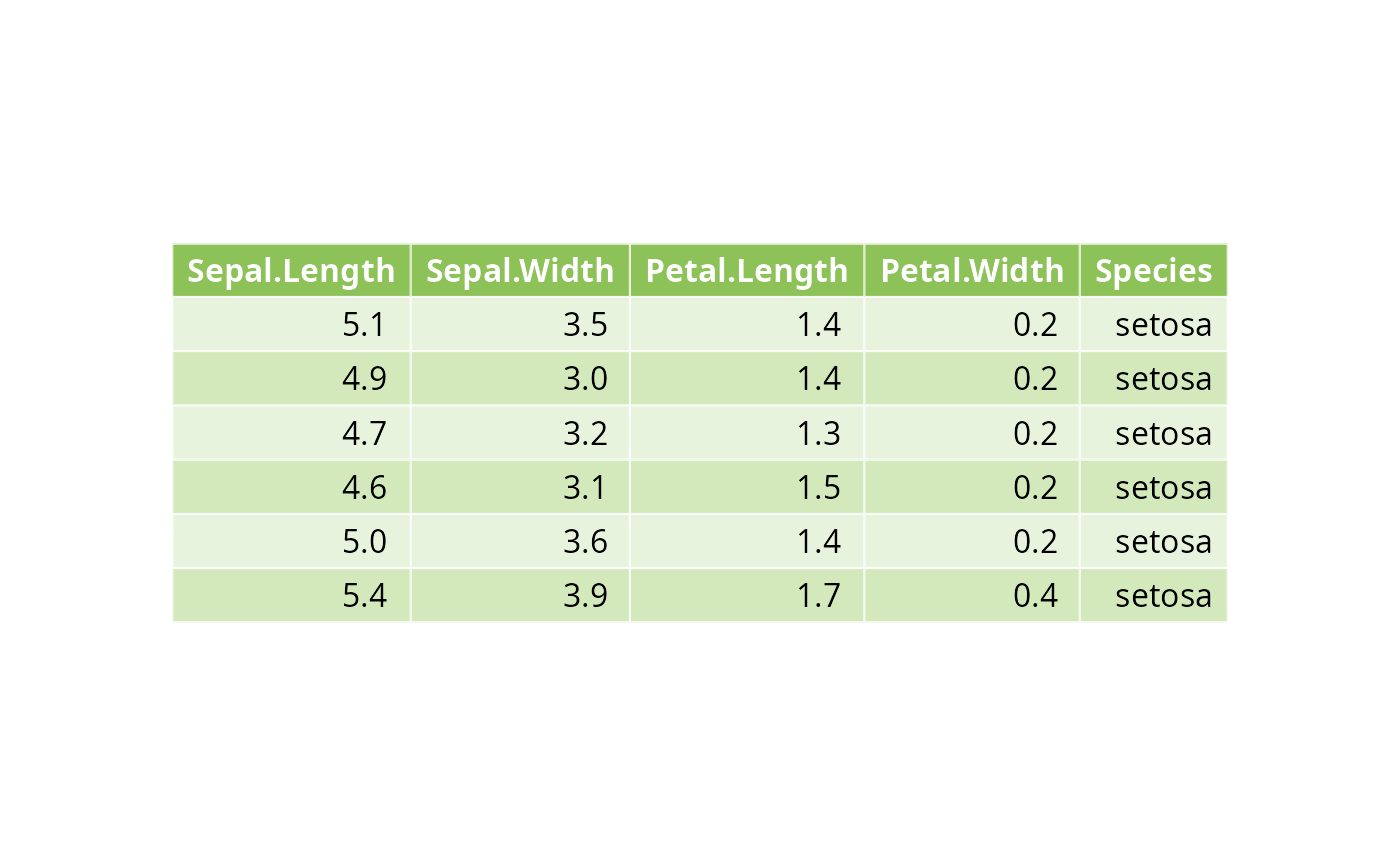
 # Text justification
#::::::::::::::::::::::::::::::::::::::::::::::
# Default is "centre" for the body and header, and "right" for the row names.
# Left justification: hjust=0, x=0.1
# Right justification: hjust=1, x=0.9
tbody.style = tbody_style(color = "black",
fill = c("#e8f3de", "#d3e8bb"), hjust=1, x=0.9)
ggtexttable(head(iris), rows = NULL,
theme = ttheme(
colnames.style = colnames_style(color = "white", fill = "#8cc257"),
tbody.style = tbody.style
)
)
# Text justification
#::::::::::::::::::::::::::::::::::::::::::::::
# Default is "centre" for the body and header, and "right" for the row names.
# Left justification: hjust=0, x=0.1
# Right justification: hjust=1, x=0.9
tbody.style = tbody_style(color = "black",
fill = c("#e8f3de", "#d3e8bb"), hjust=1, x=0.9)
ggtexttable(head(iris), rows = NULL,
theme = ttheme(
colnames.style = colnames_style(color = "white", fill = "#8cc257"),
tbody.style = tbody.style
)
)
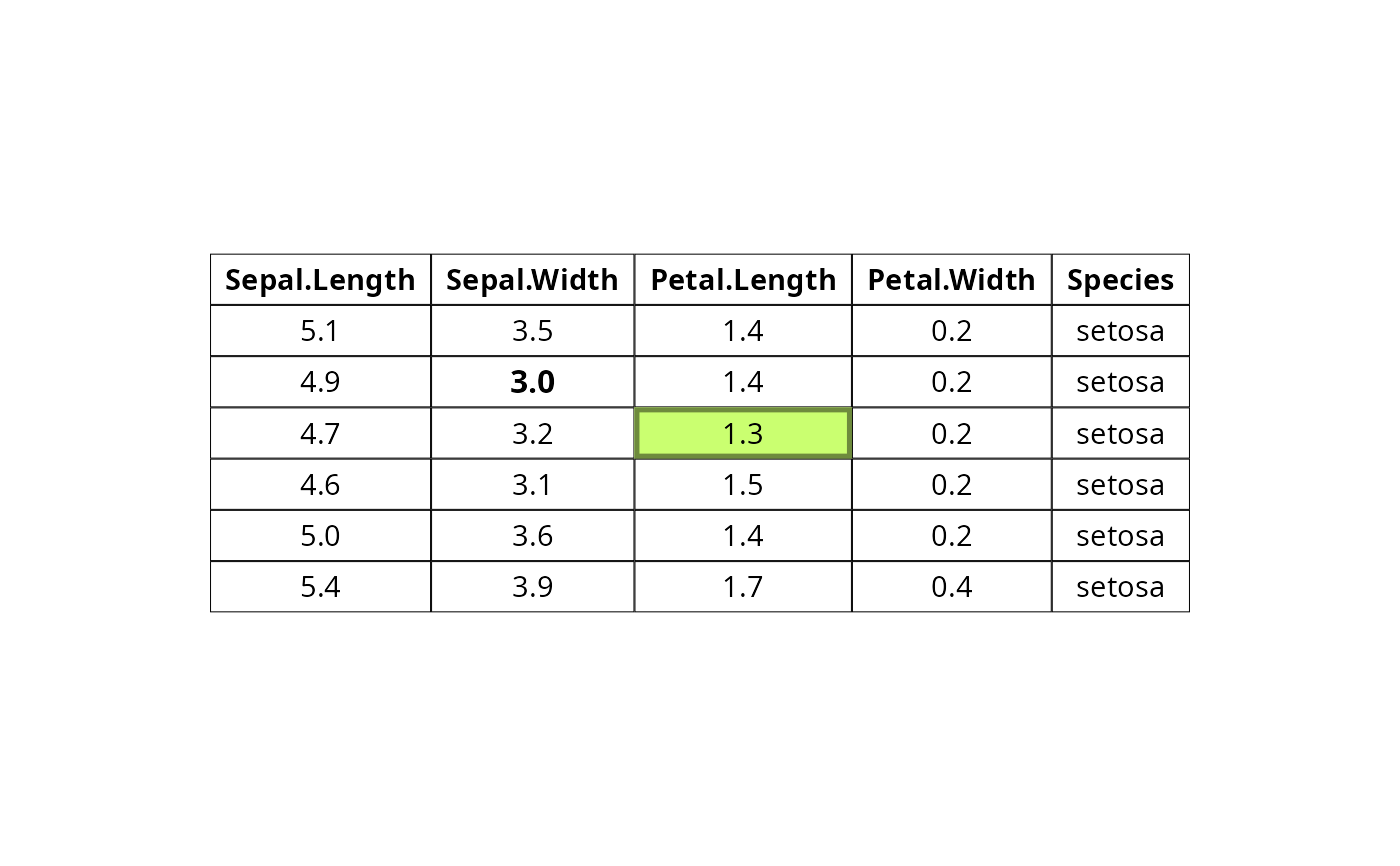
 # Access and modify the font and
# the background of table cells
# :::::::::::::::::::::::::::::::::::::::::::::
tab <- ggtexttable(head(iris), rows = NULL,
theme = ttheme("classic"))
tab <- table_cell_font(tab, row = 3, column = 2,
face = "bold")
tab <- table_cell_bg(tab, row = 4, column = 3, linewidth = 5,
fill="darkolivegreen1", color = "darkolivegreen4")
tab
# Access and modify the font and
# the background of table cells
# :::::::::::::::::::::::::::::::::::::::::::::
tab <- ggtexttable(head(iris), rows = NULL,
theme = ttheme("classic"))
tab <- table_cell_font(tab, row = 3, column = 2,
face = "bold")
tab <- table_cell_bg(tab, row = 4, column = 3, linewidth = 5,
fill="darkolivegreen1", color = "darkolivegreen4")
tab
 # Change table cells background and font for column 3,
# Spaning from row 2 to the last row in the data
tab <- ggtexttable(df, rows = NULL, theme = ttheme("classic"))
tab %>%
table_cell_bg(row = 2:tab_nrow(tab), column = 3, fill = "darkblue") %>%
table_cell_font(row = 2:tab_nrow(tab), column = 3, face = "italic", color = "white")
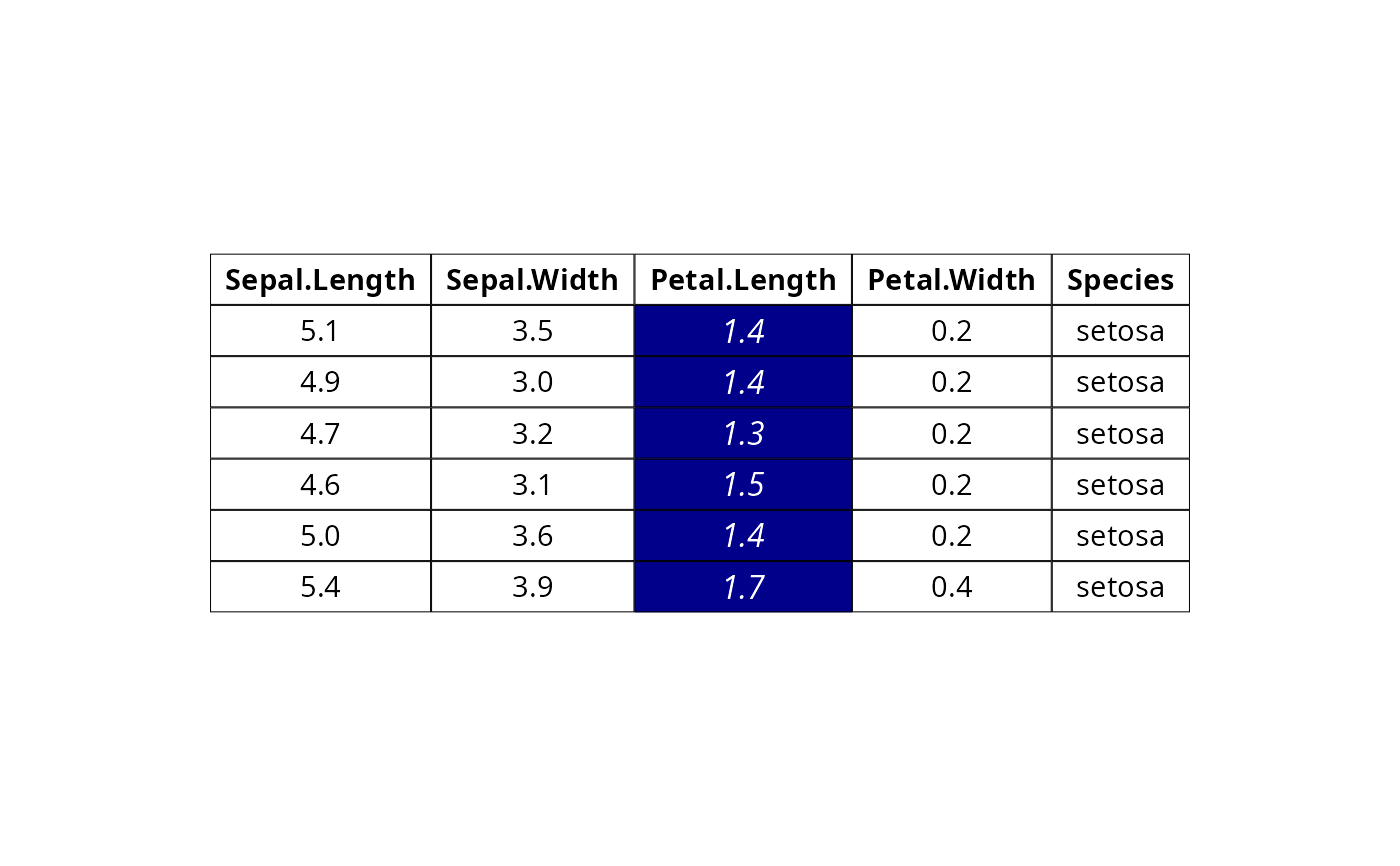
# Change table cells background and font for column 3,
# Spaning from row 2 to the last row in the data
tab <- ggtexttable(df, rows = NULL, theme = ttheme("classic"))
tab %>%
table_cell_bg(row = 2:tab_nrow(tab), column = 3, fill = "darkblue") %>%
table_cell_font(row = 2:tab_nrow(tab), column = 3, face = "italic", color = "white")
 # Add separators and borders
# :::::::::::::::::::::::::::::::::::::::::::::::::::
# Table with blank theme
tab <- ggtexttable(df, theme = ttheme("blank"), rows = NULL)
# Add horizontal and vertical lines
tab %>%
tab_add_hline(at.row = c(1, 2), row.side = "top", linewidth = 3, linetype = 1) %>%
tab_add_hline(at.row = c(7), row.side = "bottom", linewidth = 3, linetype = 1) %>%
tab_add_vline(at.column = 2:tab_ncol(tab), column.side = "left", from.row = 2, linetype = 2)
# Add separators and borders
# :::::::::::::::::::::::::::::::::::::::::::::::::::
# Table with blank theme
tab <- ggtexttable(df, theme = ttheme("blank"), rows = NULL)
# Add horizontal and vertical lines
tab %>%
tab_add_hline(at.row = c(1, 2), row.side = "top", linewidth = 3, linetype = 1) %>%
tab_add_hline(at.row = c(7), row.side = "bottom", linewidth = 3, linetype = 1) %>%
tab_add_vline(at.column = 2:tab_ncol(tab), column.side = "left", from.row = 2, linetype = 2)
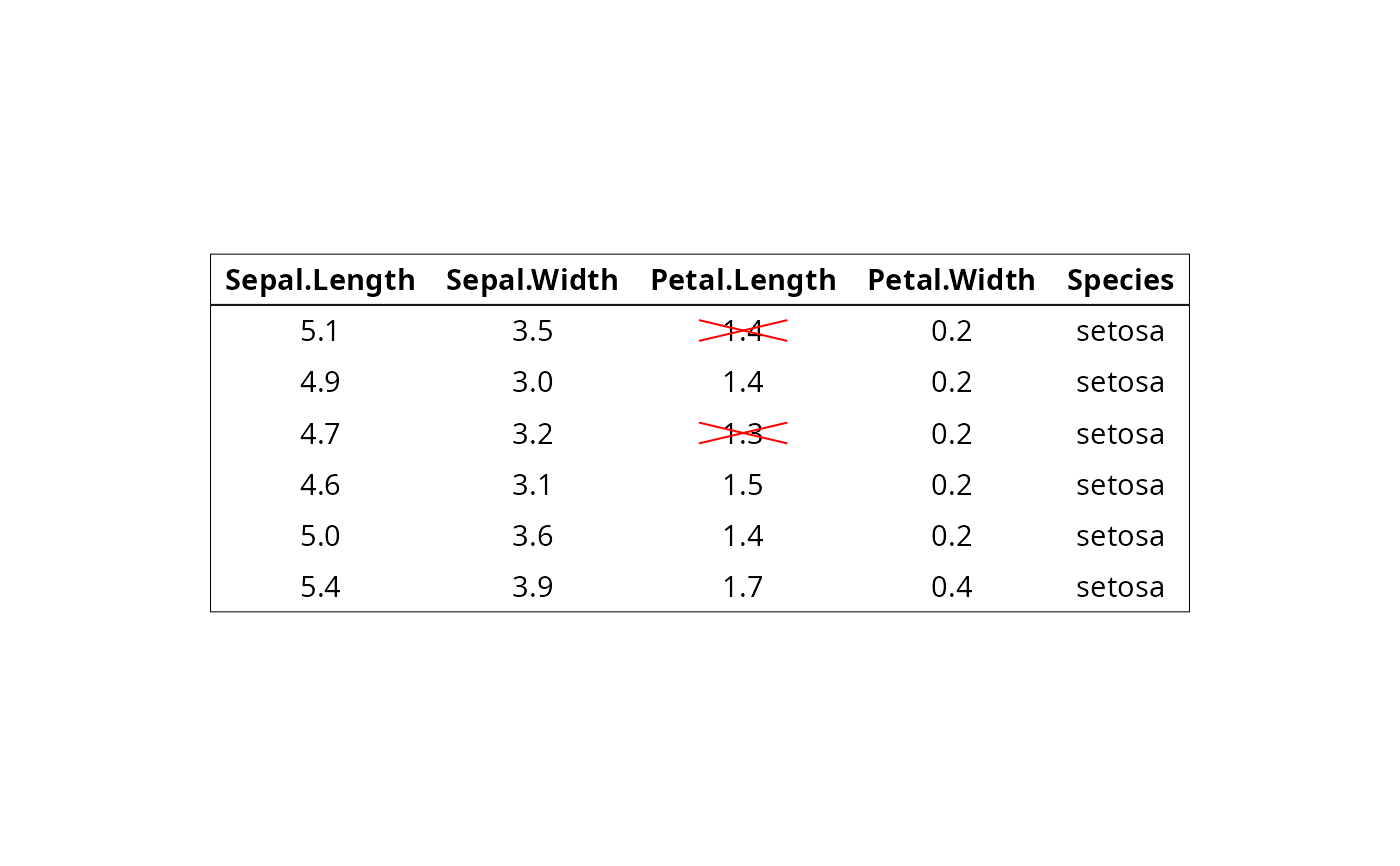
 # Add borders to table body and header
# Cross out some cells
tab %>%
tbody_add_border() %>%
thead_add_border() %>%
tab_cell_crossout(
row = c(2, 4), column = 3, linecolor = "red",
reduce.size.by = 0.6
)
# Add borders to table body and header
# Cross out some cells
tab %>%
tbody_add_border() %>%
thead_add_border() %>%
tab_cell_crossout(
row = c(2, 4), column = 3, linecolor = "red",
reduce.size.by = 0.6
)
 # Add titles andd footnote
# :::::::::::::::::::::::::::::::::::::::::::::::::::
# Add titles and footnote
# Wrap subtitle into multiple lines using strwrap()
main.title <- "Edgar Anderson's Iris Data"
subtitle <- paste0(
"This famous (Fisher's or Anderson's) iris data set gives the measurements",
" in centimeters of the variables sepal length and width and petal length and width,",
" respectively, for 50 flowers from each of 3 species of iris.",
" The species are Iris setosa, versicolor, and virginica."
) %>%
strwrap(width = 80) %>%
paste(collapse = "\n")
tab <- ggtexttable(head(iris), theme = ttheme("light"))
tab %>%
tab_add_title(text = subtitle, face = "plain", size = 10) %>%
tab_add_title(text = main.title, face = "bold", padding = unit(0.1, "line")) %>%
tab_add_footnote(text = "*Table created using ggpubr", size = 10, face = "italic")
# Add titles andd footnote
# :::::::::::::::::::::::::::::::::::::::::::::::::::
# Add titles and footnote
# Wrap subtitle into multiple lines using strwrap()
main.title <- "Edgar Anderson's Iris Data"
subtitle <- paste0(
"This famous (Fisher's or Anderson's) iris data set gives the measurements",
" in centimeters of the variables sepal length and width and petal length and width,",
" respectively, for 50 flowers from each of 3 species of iris.",
" The species are Iris setosa, versicolor, and virginica."
) %>%
strwrap(width = 80) %>%
paste(collapse = "\n")
tab <- ggtexttable(head(iris), theme = ttheme("light"))
tab %>%
tab_add_title(text = subtitle, face = "plain", size = 10) %>%
tab_add_title(text = main.title, face = "bold", padding = unit(0.1, "line")) %>%
tab_add_footnote(text = "*Table created using ggpubr", size = 10, face = "italic")
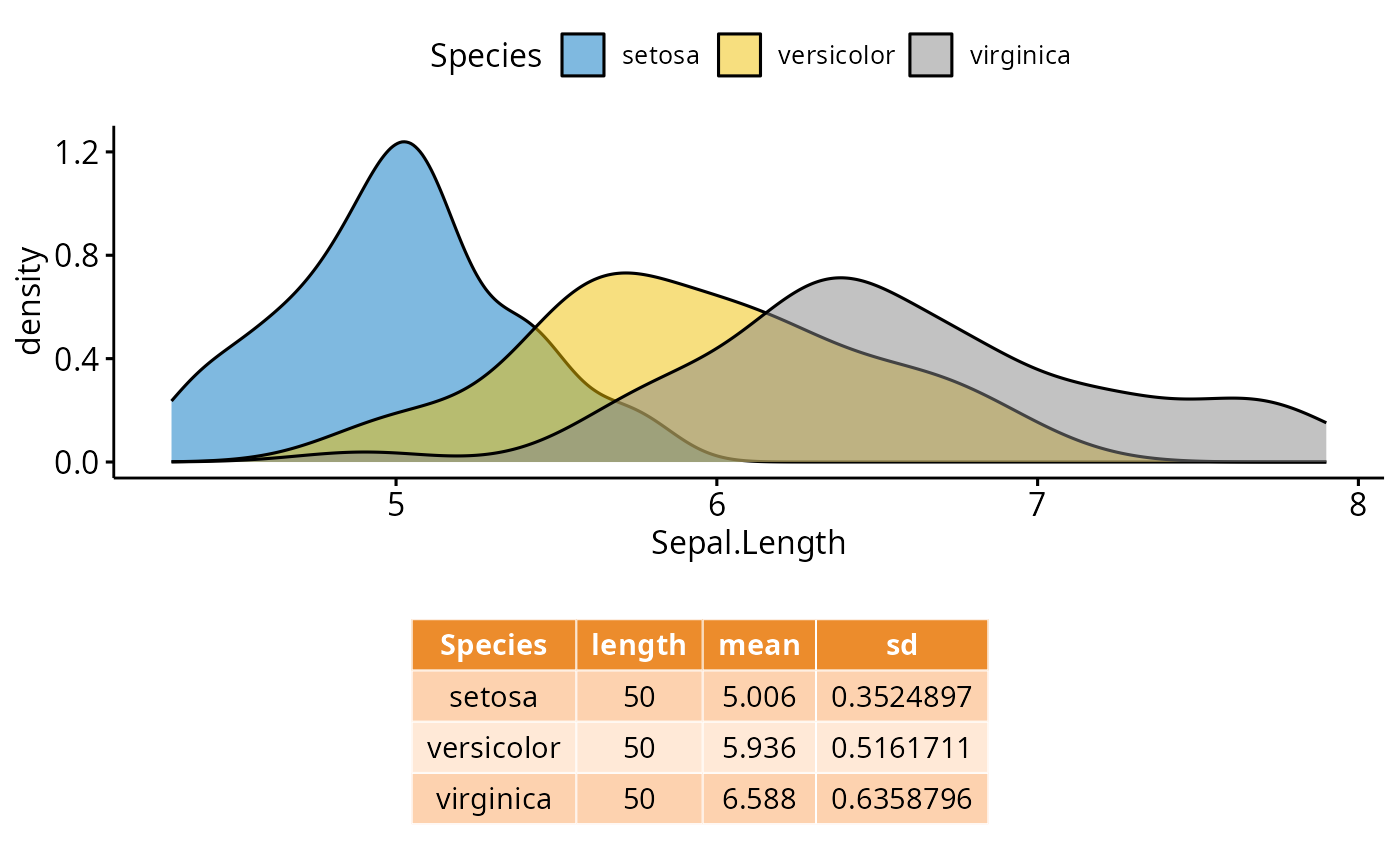
 # Combine density plot and summary table
#:::::::::::::::::::::::::::::::::::::
# Density plot of "Sepal.Length"
density.p <- ggdensity(iris, x = "Sepal.Length",
fill = "Species", palette = "jco")
# Draw the summary table of Sepal.Length
# Descriptive statistics by groups
stable <- desc_statby(iris, measure.var = "Sepal.Length",
grps = "Species")
stable <- stable[, c("Species", "length", "mean", "sd")]
stable.p <- ggtexttable(stable, rows = NULL,
theme = ttheme("mOrange"))
# Arrange the plots on the same page
ggarrange(density.p, stable.p,
ncol = 1, nrow = 2,
heights = c(1, 0.5))
# Combine density plot and summary table
#:::::::::::::::::::::::::::::::::::::
# Density plot of "Sepal.Length"
density.p <- ggdensity(iris, x = "Sepal.Length",
fill = "Species", palette = "jco")
# Draw the summary table of Sepal.Length
# Descriptive statistics by groups
stable <- desc_statby(iris, measure.var = "Sepal.Length",
grps = "Species")
stable <- stable[, c("Species", "length", "mean", "sd")]
stable.p <- ggtexttable(stable, rows = NULL,
theme = ttheme("mOrange"))
# Arrange the plots on the same page
ggarrange(density.p, stable.p,
ncol = 1, nrow = 2,
heights = c(1, 0.5))