Draw a paragraph o text. Splits a long text into multiple lines (by inserting line breaks) so that the output will fit within the current viewport.
Usage
ggparagraph(
  text,
  color = NULL,
  size = NULL,
  face = NULL,
  family = NULL,
  lineheight = NULL
)

# S3 method for class 'splitText'
drawDetails(x, recording)
Arguments
- text
the text to plot.
- color
font color, example: color = "black"
- size
font size, example: size = 12
- face
font face. Allowed values are one of "plain", "italic", "bold", "bold.italic".
- family
font family
- lineheight
Line height, example: lineheight = 2.
- x
a grid grob
- recording
a logical value indicating whether a grob is being added to the display list or redrawn from the display list.
Examples
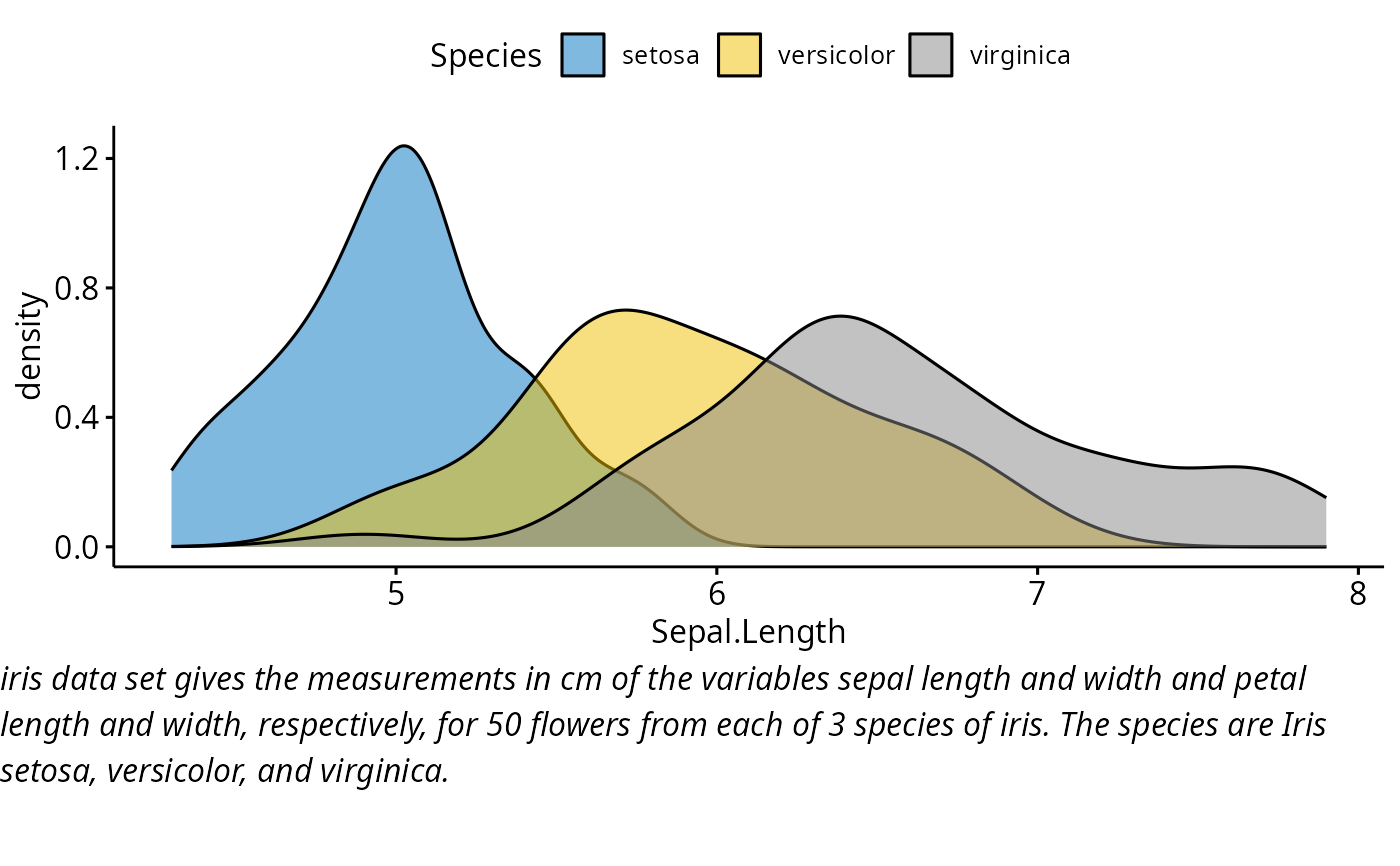
# Density plot
density.p <- ggdensity(iris, x = "Sepal.Length",
                      fill = "Species", palette = "jco")

# Text plot
text <- paste("iris data set gives the measurements in cm",
             "of the variables sepal length and width",
             "and petal length and width, respectively,",
             "for 50 flowers from each of 3 species of iris.",
             "The species are Iris setosa, versicolor, and virginica.", sep = " ")
text.p <- ggparagraph(text, face = "italic", size = 12)

# Arrange the plots on the same page
ggarrange(density.p, text.p,
         ncol = 1, nrow = 2,
         heights = c(1, 0.3))