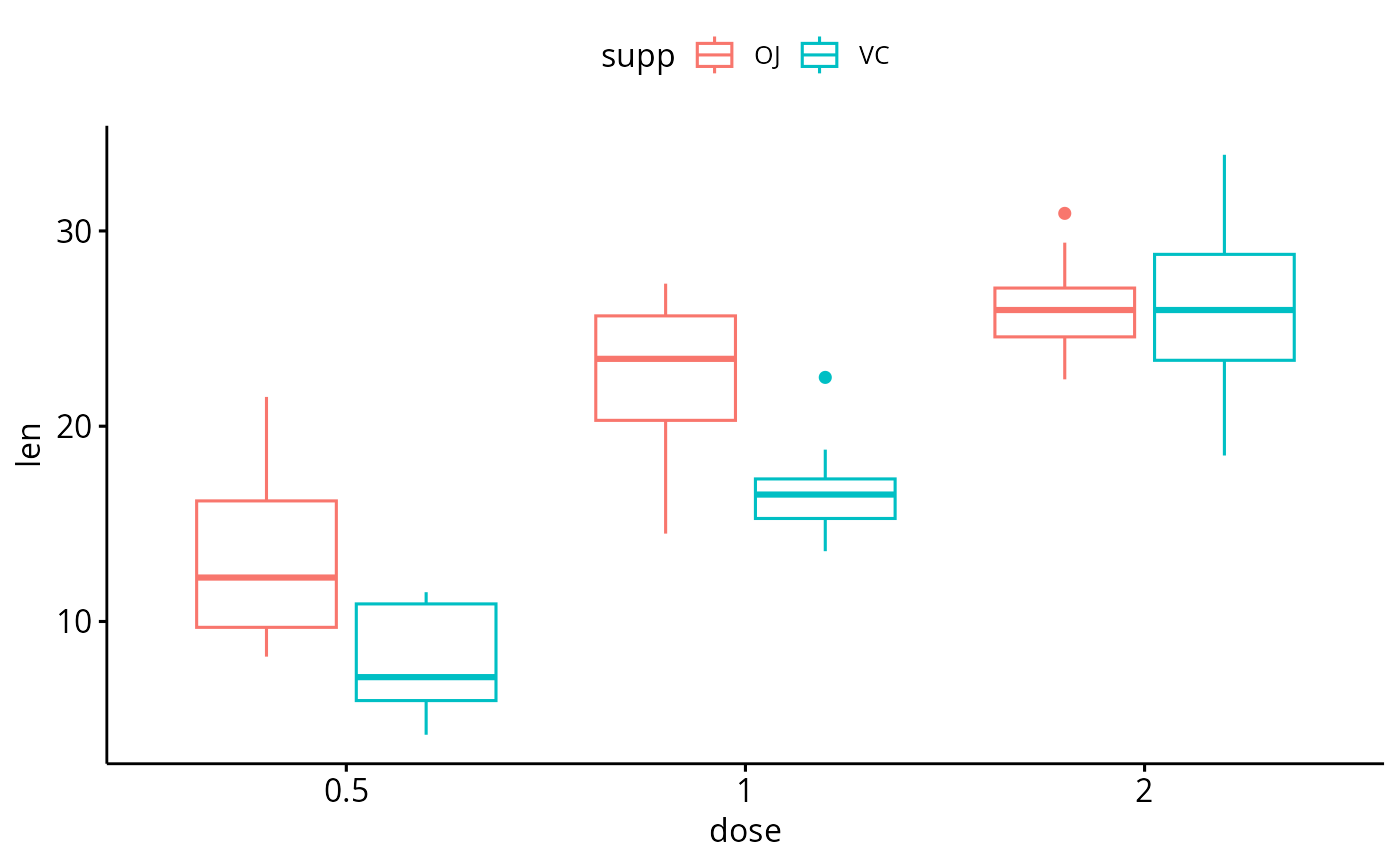
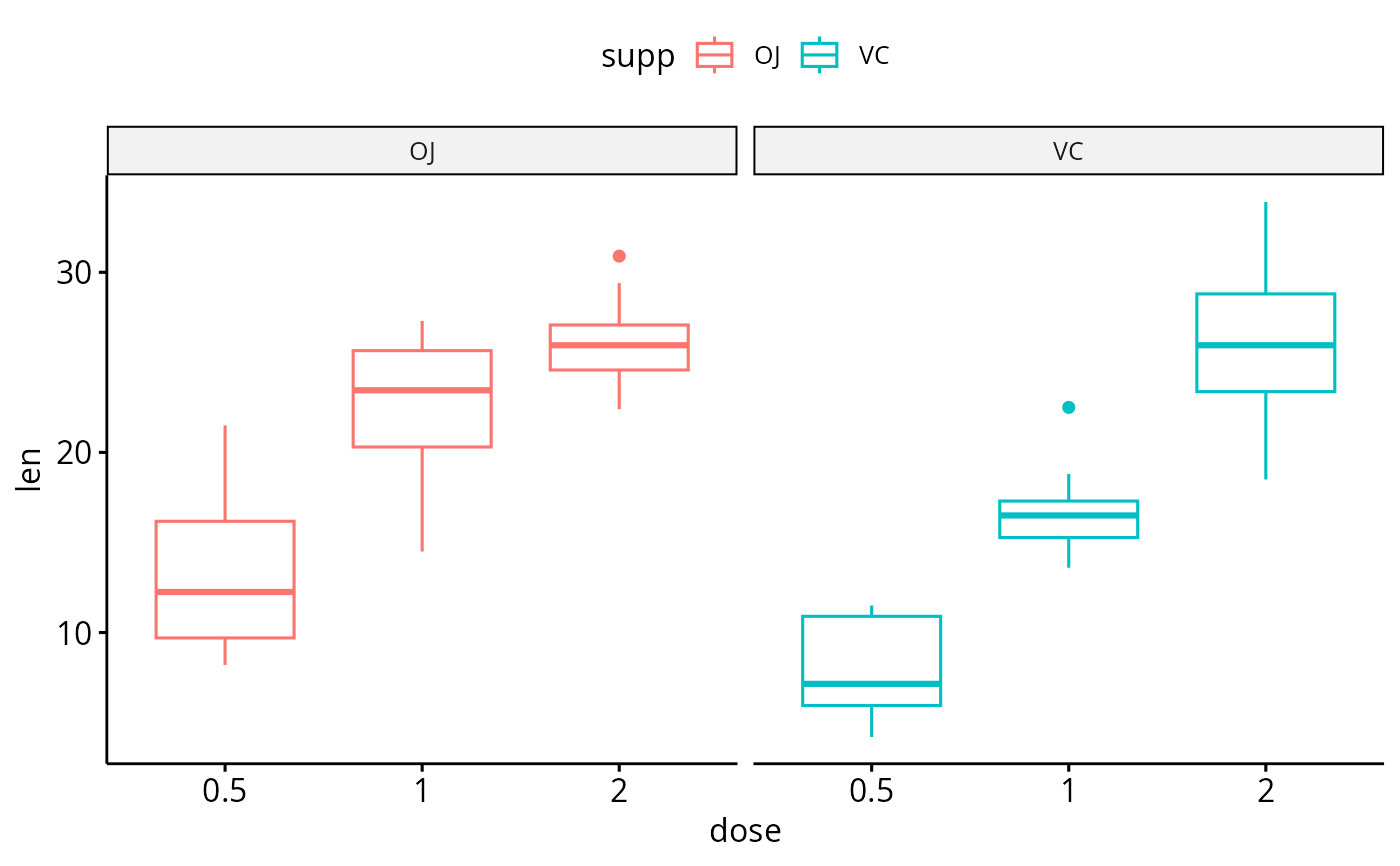
Create multi-panel plots of a data set grouped by one or two
grouping variables. Wrapper around facet_wrap
Usage
facet(
  p,
  facet.by,
  nrow = NULL,
  ncol = NULL,
  scales = "fixed",
  short.panel.labs = TRUE,
  labeller = "label_value",
  panel.labs = NULL,
  panel.labs.background = list(color = NULL, fill = NULL),
  panel.labs.font = list(face = NULL, color = NULL, size = NULL, angle = NULL),
  panel.labs.font.x = panel.labs.font,
  panel.labs.font.y = panel.labs.font,
  strip.position = "top",
  ...
)
Arguments
- p
a ggplot
- facet.by
character vector, of length 1 or 2, specifying grouping variables for faceting the plot into multiple panels. Should be in the data.
- nrow, ncol
Number of rows and columns in the panel. Used only when the data is faceted by one grouping variable.
- scales
should axis scales of panels be fixed ("fixed", the default), free ("free"), or free in one dimension ("free_x", "free_y").
- short.panel.labs
logical value. Default is TRUE. If TRUE, create short labels for panels by omitting variable names; in other words panels will be labelled only by variable grouping levels.
- labeller
Character vector. An alternative to the argument
short.panel.labs. Possible values are one of "label_both" (panel labelled by both grouping variable names and levels) and "label_value" (panel labelled with only grouping levels).- panel.labs
a list of one or two character vectors to modify facet panel labels. For example, panel.labs = list(sex = c("Male", "Female")) specifies the labels for the "sex" variable. For two grouping variables, you can use for example panel.labs = list(sex = c("Male", "Female"), rx = c("Obs", "Lev", "Lev2") ).
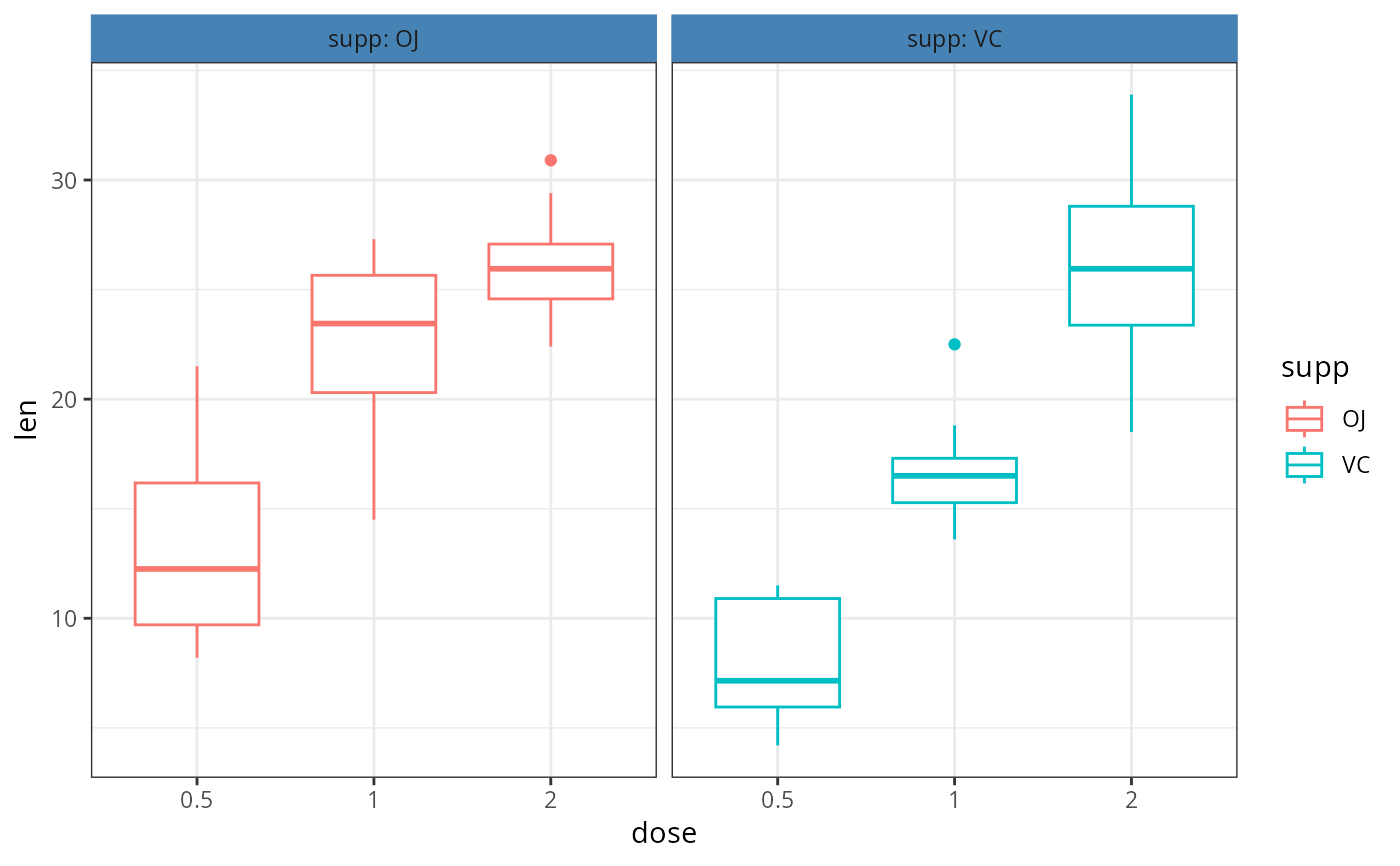
- panel.labs.background
a list to customize the background of panel labels. Should contain the combination of the following elements:
color, linetype, size: background line color, type and sizefill: background fill color.
For example, panel.labs.background = list(color = "blue", fill = "pink", linetype = "dashed", size = 0.5).
- panel.labs.font
a list of aestheics indicating the size (e.g.: 14), the face/style (e.g.: "plain", "bold", "italic", "bold.italic") and the color (e.g.: "red") and the orientation angle (e.g.: 45) of panel labels.
- panel.labs.font.x, panel.labs.font.y
same as panel.labs.font but for only x and y direction, respectively.
- strip.position
(used only in
facet_wrap()). By default, the labels are displayed on the top of the plot. Usingstrip.positionit is possible to place the labels on either of the four sides by settingstrip.position = c("top", "bottom", "left", "right")- ...
not used