Small arrows on plot margins can supplement a 2d display with annotations.
Arrows can be used to highlight specific values along a margin. The geometries
geom_x_margin_arrow() and geom_y_margin_arrow() behave
similarly geom_vline() and geom_hline() and share their "double
personality" as both annotations and geometries.
geom_x_margin_arrow(
  mapping = NULL,
  data = NULL,
  stat = "identity",
  position = "identity",
  ...,
  xintercept,
  sides = "b",
  arrow.length = 0.03,
  na.rm = FALSE,
  show.legend = FALSE,
  inherit.aes = FALSE
)

geom_y_margin_arrow(
  mapping = NULL,
  data = NULL,
  stat = "identity",
  position = "identity",
  ...,
  yintercept,
  sides = "l",
  arrow.length = 0.03,
  na.rm = FALSE,
  show.legend = FALSE,
  inherit.aes = FALSE
)
Arguments
- mapping
The aesthetic mapping, usually constructed with
aes. Only needs to be set at the layer level if you are overriding the plot defaults.- data
A layer specific dataset - only needed if you want to override the plot defaults.
- stat
The statistical transformation to use on the data for this layer, as a string.
- position
Position adjustment, either as a string, or the result of a call to a position adjustment function.
- ...
other arguments passed on to
layer. This can include aesthetics whose values you want to set, not map. Seelayerfor more details.- xintercept, yintercept
numeric Parameters that control the position of the marginal points. If these are set, data, mapping and show.legend are overridden.
- sides
A string that controls which sides of the plot the rugs appear on. It can be set to a string containing any combination of
"trbl", for top, right, bottom, and left.- arrow.length
numeric value expressed in npc units for the length of the arows inwards from the edge of the plotting area.
- na.rm
If
FALSE(the default), removes missing values with a warning. IfTRUEsilently removes missing values.- show.legend
logical. Should this layer be included in the legends?
NA, the default, includes if any aesthetics are mapped.FALSEnever includes, andTRUEalways includes.- inherit.aes
If
FALSE, overrides the default aesthetics, rather than combining with them. This is most useful for helper functions that define both data and aesthetics and shouldn't inherit behaviour from the default plot specification, e.g.,borders.
Value
A plot layer instance.
See also
Other Geometries for marginal annotations in ggplots:
geom_x_margin_grob(),
geom_x_margin_point()
Examples
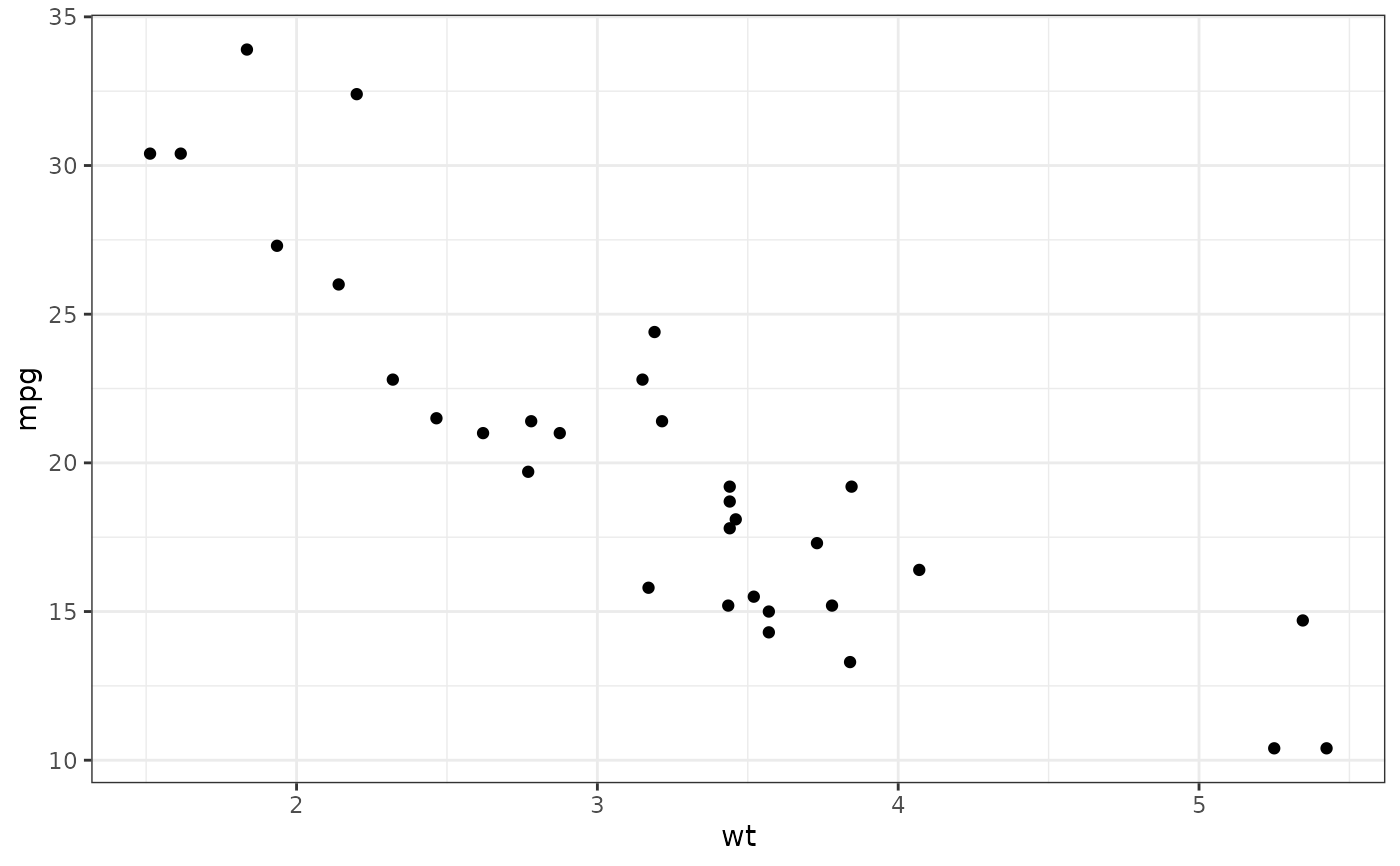
p <- ggplot(mtcars, aes(wt, mpg)) +
geom_point()
p
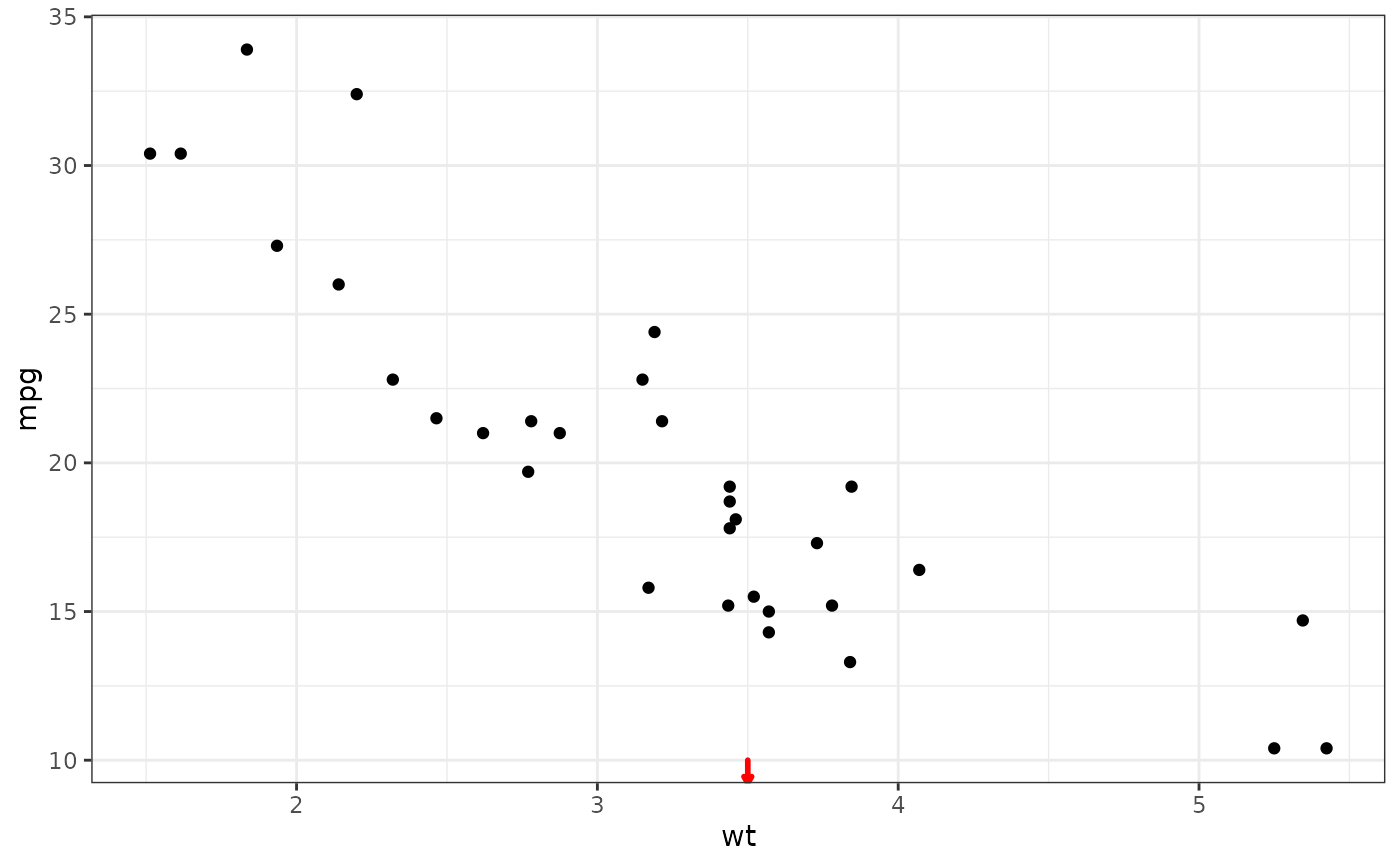
 p + geom_x_margin_arrow(xintercept = 3.5)
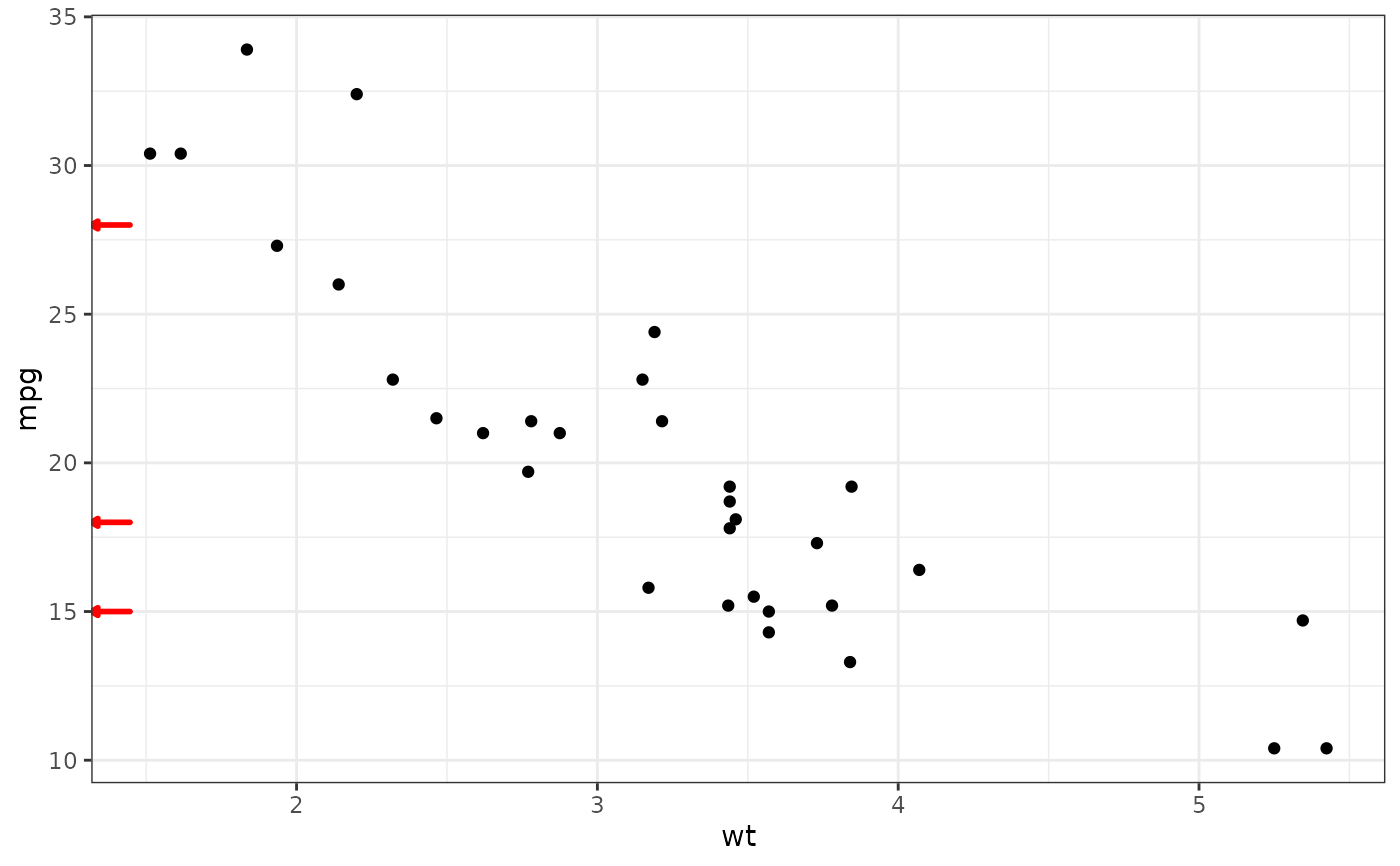
 p + geom_y_margin_arrow(yintercept = c(18, 28, 15))
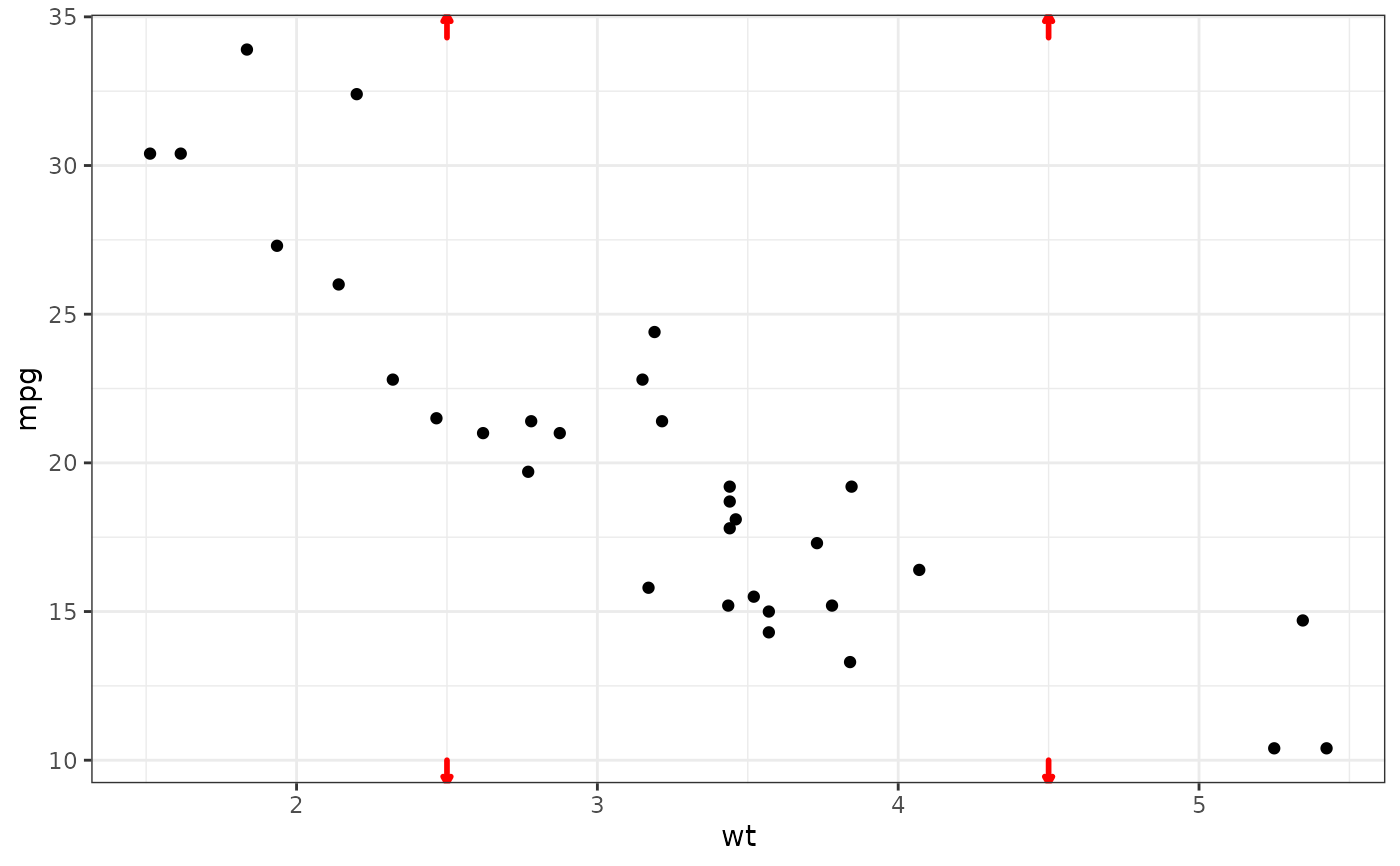
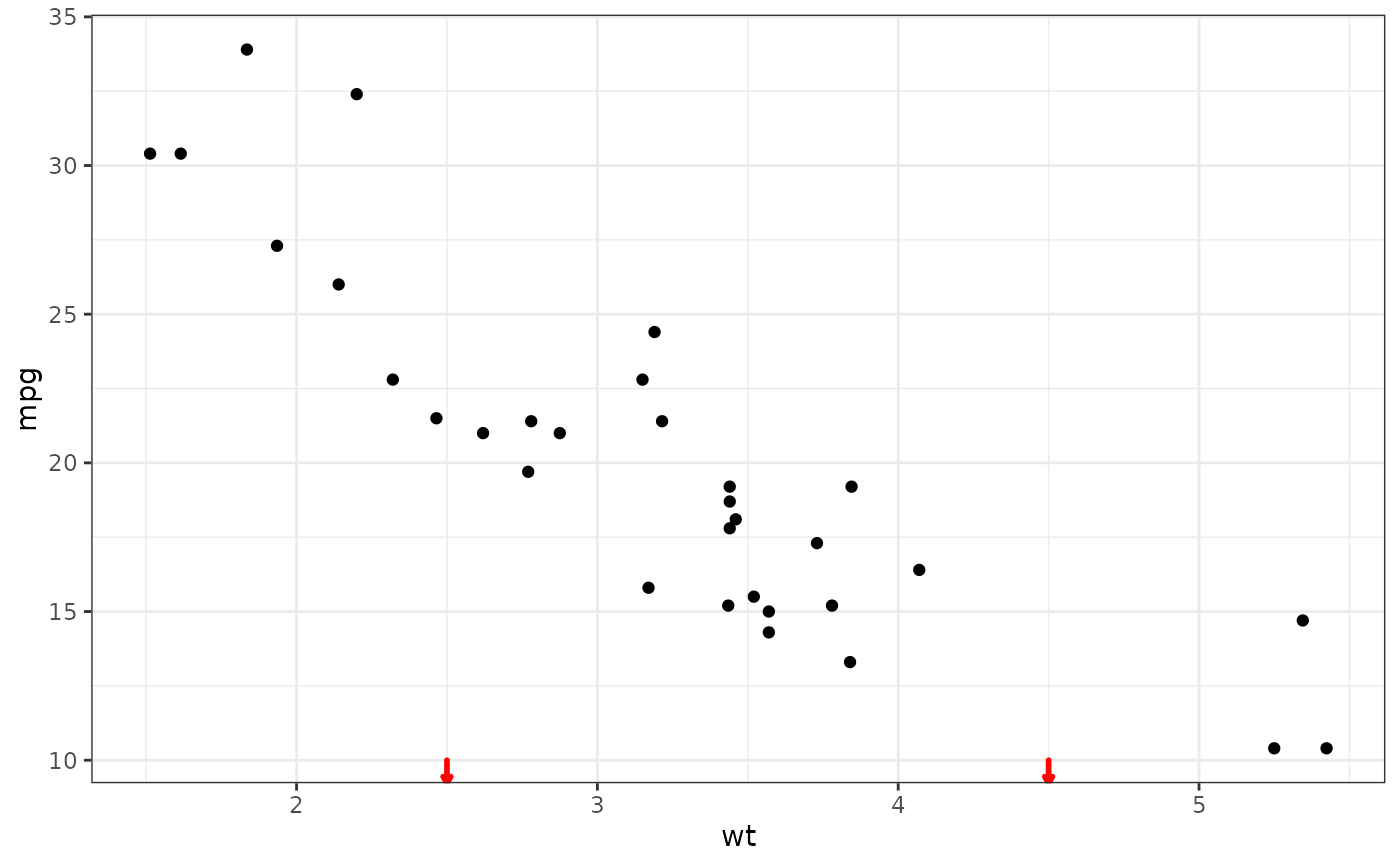
 p + geom_x_margin_arrow(data = data.frame(x = c(2.5, 4.5)),
mapping = aes(xintercept = x))
p + geom_x_margin_arrow(data = data.frame(x = c(2.5, 4.5)),
mapping = aes(xintercept = x))
 p + geom_x_margin_arrow(data = data.frame(x = c(2.5, 4.5)),
mapping = aes(xintercept = x),
sides="tb")
p + geom_x_margin_arrow(data = data.frame(x = c(2.5, 4.5)),
mapping = aes(xintercept = x),
sides="tb")