
Benchmark plot creation time. Broken down into construct, build, render and draw times.
Source:R/bench.R
benchplot.RdBenchmark plot creation time. Broken down into construct, build, render and draw times.
Examples
benchplot(ggplot(mtcars, aes(mpg, wt)) + geom_point())
#> step user.self sys.self elapsed
#> 1 construct 0.006 0 0.006
#> 2 build 0.033 0 0.055
#> 3 render 0.033 0 0.032
#> 4 draw 0.015 0 0.015
#> 5 TOTAL 0.087 0 0.108
benchplot(ggplot(mtcars, aes(mpg, wt)) + geom_point() + facet_grid(. ~ cyl))
#> step user.self sys.self elapsed
#> 1 construct 0.004 0 0.005
#> 2 build 0.036 0 0.036
#> 3 render 0.077 0 0.077
#> 4 draw 0.032 0 0.032
#> 5 TOTAL 0.149 0 0.150
# With tidy eval:
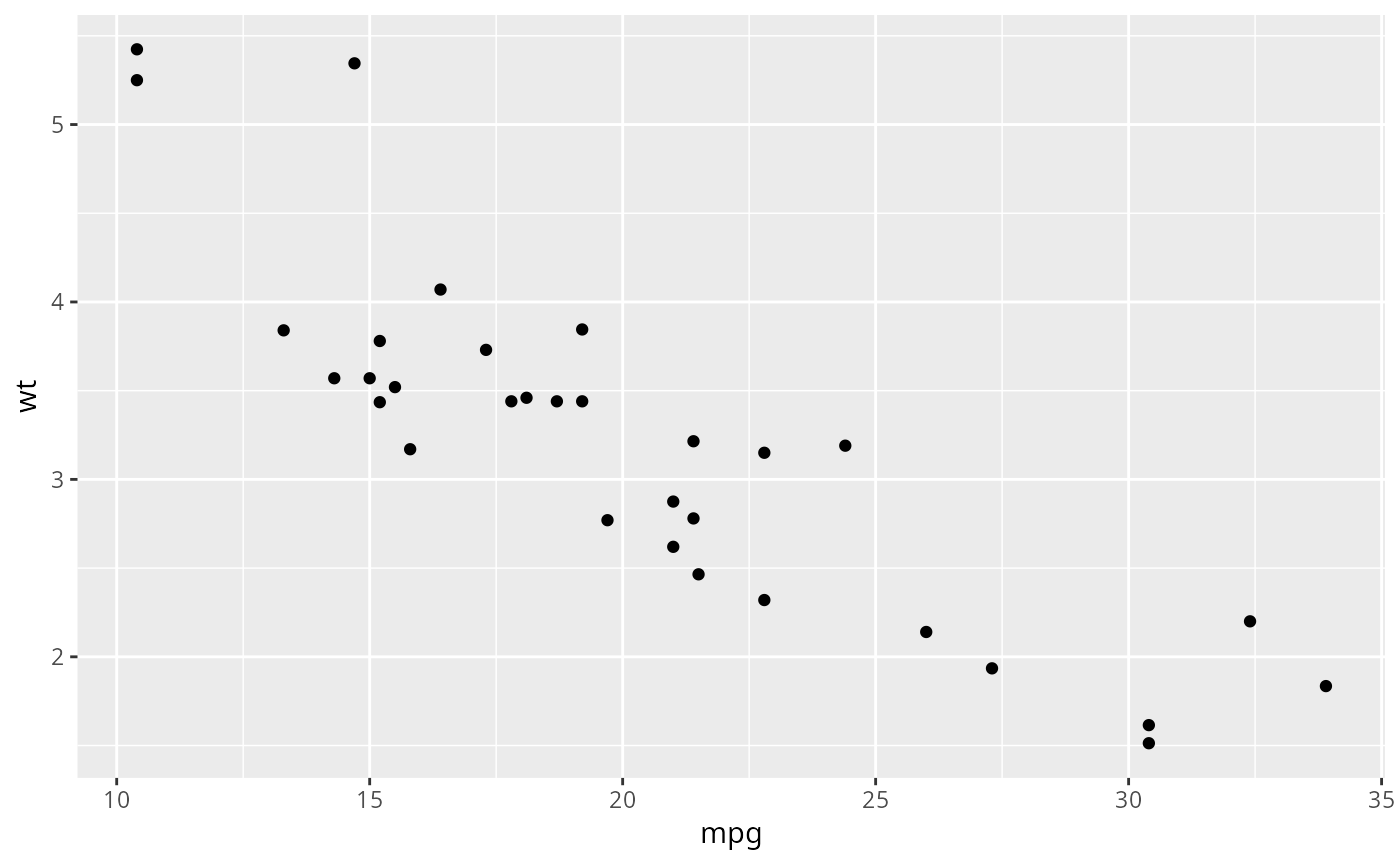
p <- expr(ggplot(mtcars, aes(mpg, wt)) + geom_point())
benchplot(!!p)
 #> step user.self sys.self elapsed
#> 1 construct 0.005 0 0.006
#> 2 build 0.022 0 0.021
#> 3 render 0.043 0 0.043
#> 4 draw 0.016 0 0.016
#> 5 TOTAL 0.086 0 0.086
#> step user.self sys.self elapsed
#> 1 construct 0.005 0 0.006
#> 2 build 0.022 0 0.021
#> 3 render 0.043 0 0.043
#> 4 draw 0.016 0 0.016
#> 5 TOTAL 0.086 0 0.086