A violin plot is a compact display of a continuous distribution. It is a blend of [geom_boxplot()] and [geom_density()]: a violin plot is a mirrored density plot displayed in the same way as a boxplot.
Usage
geom_half_violin(
  mapping = NULL,
  data = NULL,
  stat = "half_ydensity",
  position = "dodge",
  ...,
  side = "l",
  nudge = 0,
  draw_quantiles = NULL,
  trim = TRUE,
  scale = "area",
  na.rm = FALSE,
  show.legend = NA,
  inherit.aes = TRUE
)

stat_half_ydensity(
  mapping = NULL,
  data = NULL,
  geom = "half_violin",
  position = "dodge",
  ...,
  bw = "nrd0",
  adjust = 1,
  kernel = "gaussian",
  trim = TRUE,
  scale = "area",
  na.rm = FALSE,
  show.legend = NA,
  inherit.aes = TRUE
)
Arguments
- mapping
Set of aesthetic mappings created by
aes()oraes_(). If specified andinherit.aes = TRUE(the default), it is combined with the default mapping at the top level of the plot. You must supplymappingif there is no plot mapping.- data
The data to be displayed in this layer. There are three options:
If
NULL, the default, the data is inherited from the plot data as specified in the call toggplot().A
data.frame, or other object, will override the plot data. All objects will be fortified to produce a data frame. Seefortify()for which variables will be created.A
functionwill be called with a single argument, the plot data. The return value must be adata.frame, and will be used as the layer data. Afunctioncan be created from aformula(e.g.~ head(.x, 10)).- position
Position adjustment, either as a string, or the result of a call to a position adjustment function.
- ...
Other arguments passed on to
layer(). These are often aesthetics, used to set an aesthetic to a fixed value, likecolour = "red"orsize = 3. They may also be parameters to the paired geom/stat.- side
The side on which to draw the half violin plot. "l" for left, "r" for right, defaults to "l".
- nudge
Add space between the violinplot and the middle of the space allotted to a given factor on the x-axis.
- draw_quantiles
If
not(NULL)(default), draw horizontal lines at the given quantiles of the density estimate.- trim
If
TRUE(default), trim the tails of the violins to the range of the data. IfFALSE, don't trim the tails.- scale
if "area" (default), all violins have the same area (before trimming the tails). If "count", areas are scaled proportionally to the number of observations. If "width", all violins have the same maximum width.
- na.rm
If
FALSE, the default, missing values are removed with a warning. IfTRUE, missing values are silently removed.- show.legend
logical. Should this layer be included in the legends?
NA, the default, includes if any aesthetics are mapped.FALSEnever includes, andTRUEalways includes. It can also be a named logical vector to finely select the aesthetics to display.- inherit.aes
If
FALSE, overrides the default aesthetics, rather than combining with them. This is most useful for helper functions that define both data and aesthetics and shouldn't inherit behaviour from the default plot specification, e.g.borders().- geom, stat
Use to override the default connection between
geom_violin()andstat_ydensity().- bw
The smoothing bandwidth to be used. If numeric, the standard deviation of the smoothing kernel. If character, a rule to choose the bandwidth, as listed in
stats::bw.nrd().- adjust
A multiplicate bandwidth adjustment. This makes it possible to adjust the bandwidth while still using the a bandwidth estimator. For example,
adjust = 1/2means use half of the default bandwidth.- kernel
Kernel. See list of available kernels in
density().
Details
The half-violin plot accepts an optional `split` aesthethic to compare data separated by a binary variable side-by-side.
References
Hintze, J. L., Nelson, R. D. (1998) Violin Plots: A Box Plot-Density Trace Synergism. The American Statistician 52, 181-184.
Examples
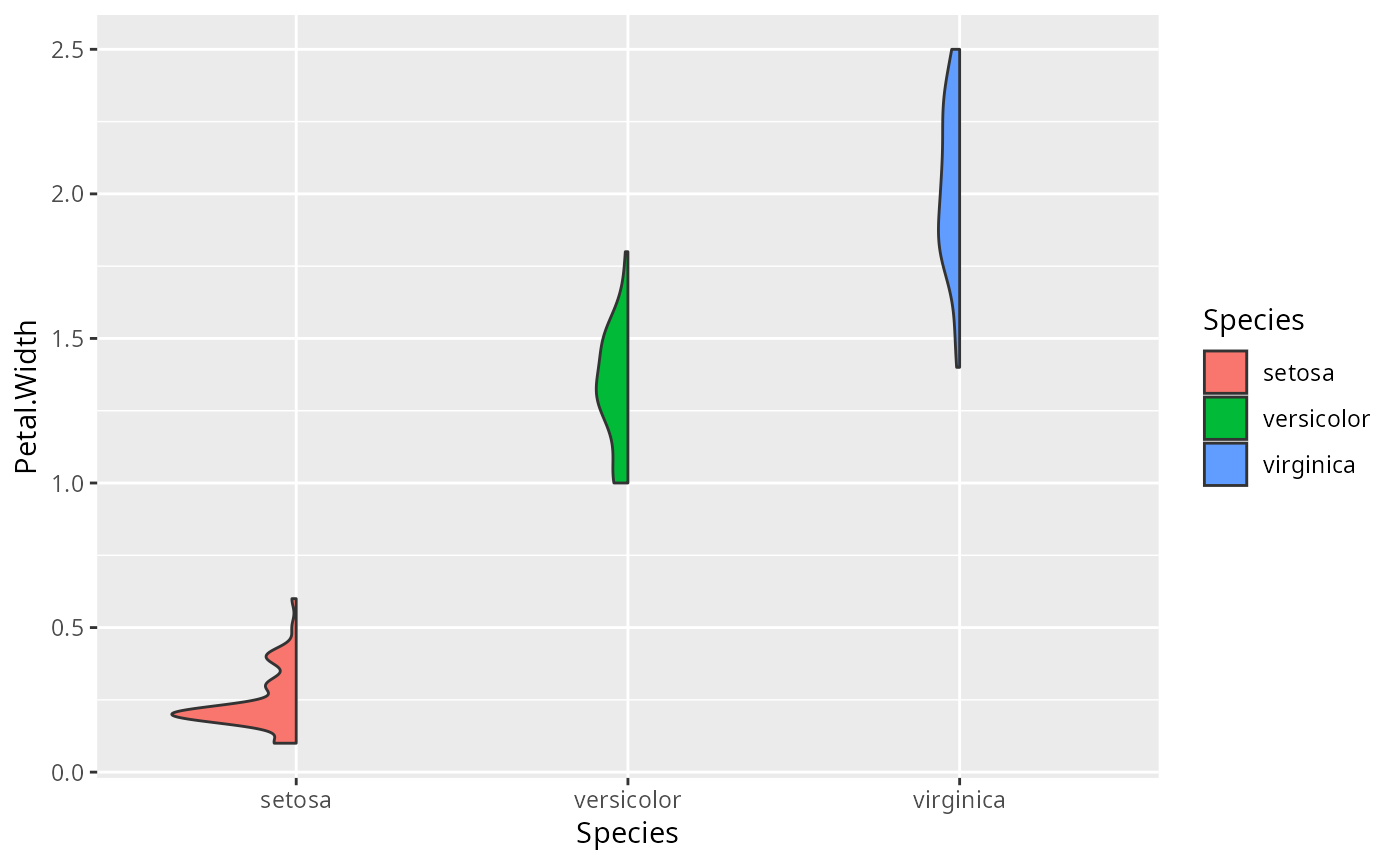
ggplot(iris, aes(x = Species, y = Petal.Width, fill = Species)) +
geom_half_violin()
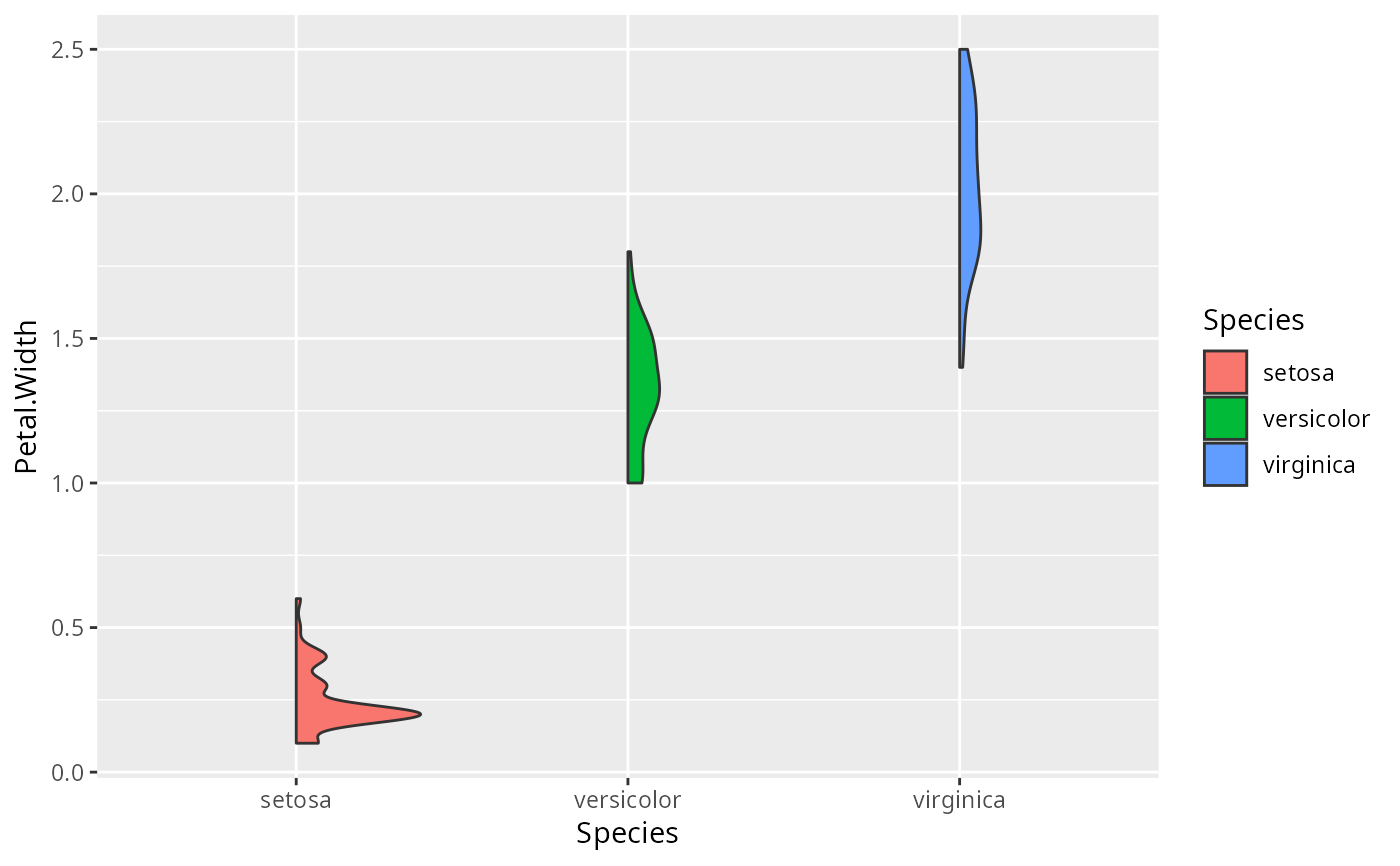
 ggplot(iris, aes(x = Species, y = Petal.Width, fill = Species)) +
geom_half_violin(side = "r")
ggplot(iris, aes(x = Species, y = Petal.Width, fill = Species)) +
geom_half_violin(side = "r")
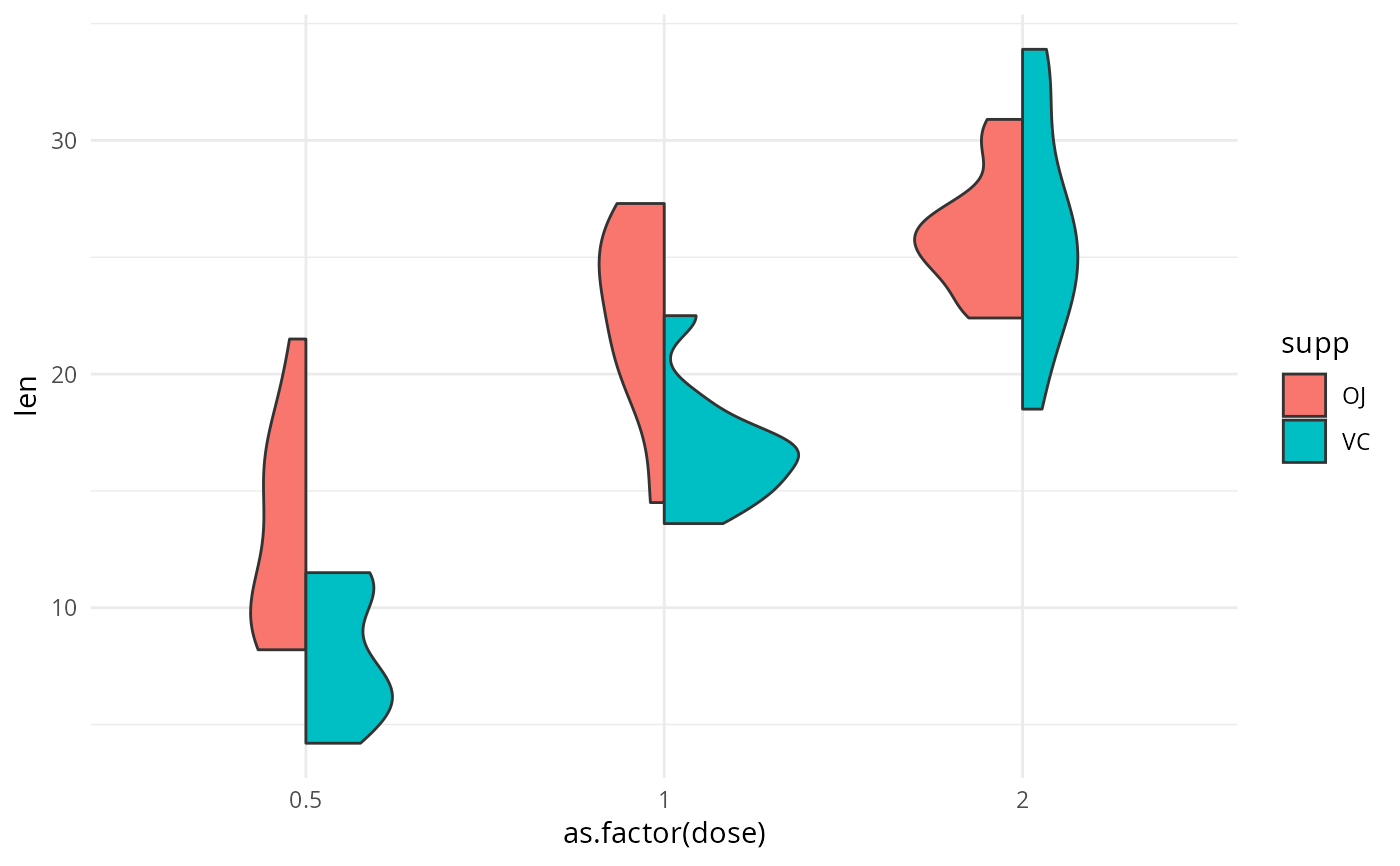
 ggplot() +
geom_half_violin(
data = ToothGrowth,
aes(x = as.factor(dose), y = len, split = supp, fill = supp),
position = "identity"
) +
theme_minimal()
ggplot() +
geom_half_violin(
data = ToothGrowth,
aes(x = as.factor(dose), y = len, split = supp, fill = supp),
position = "identity"
) +
theme_minimal()
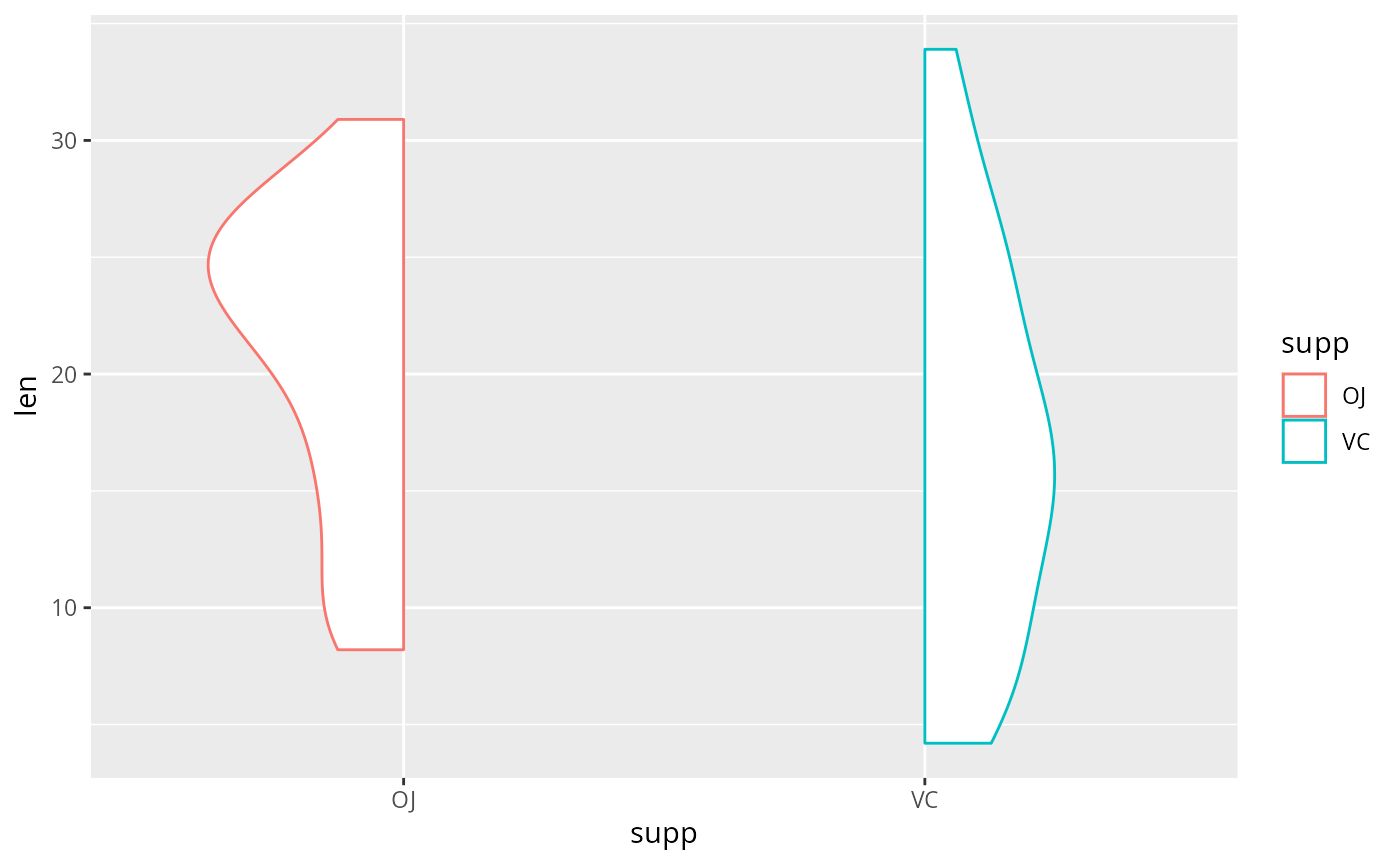
 ggplot(ToothGrowth, aes(x = supp, y = len, color = supp)) +
geom_half_violin(side = c("l", "r"))
ggplot(ToothGrowth, aes(x = supp, y = len, color = supp)) +
geom_half_violin(side = c("l", "r"))
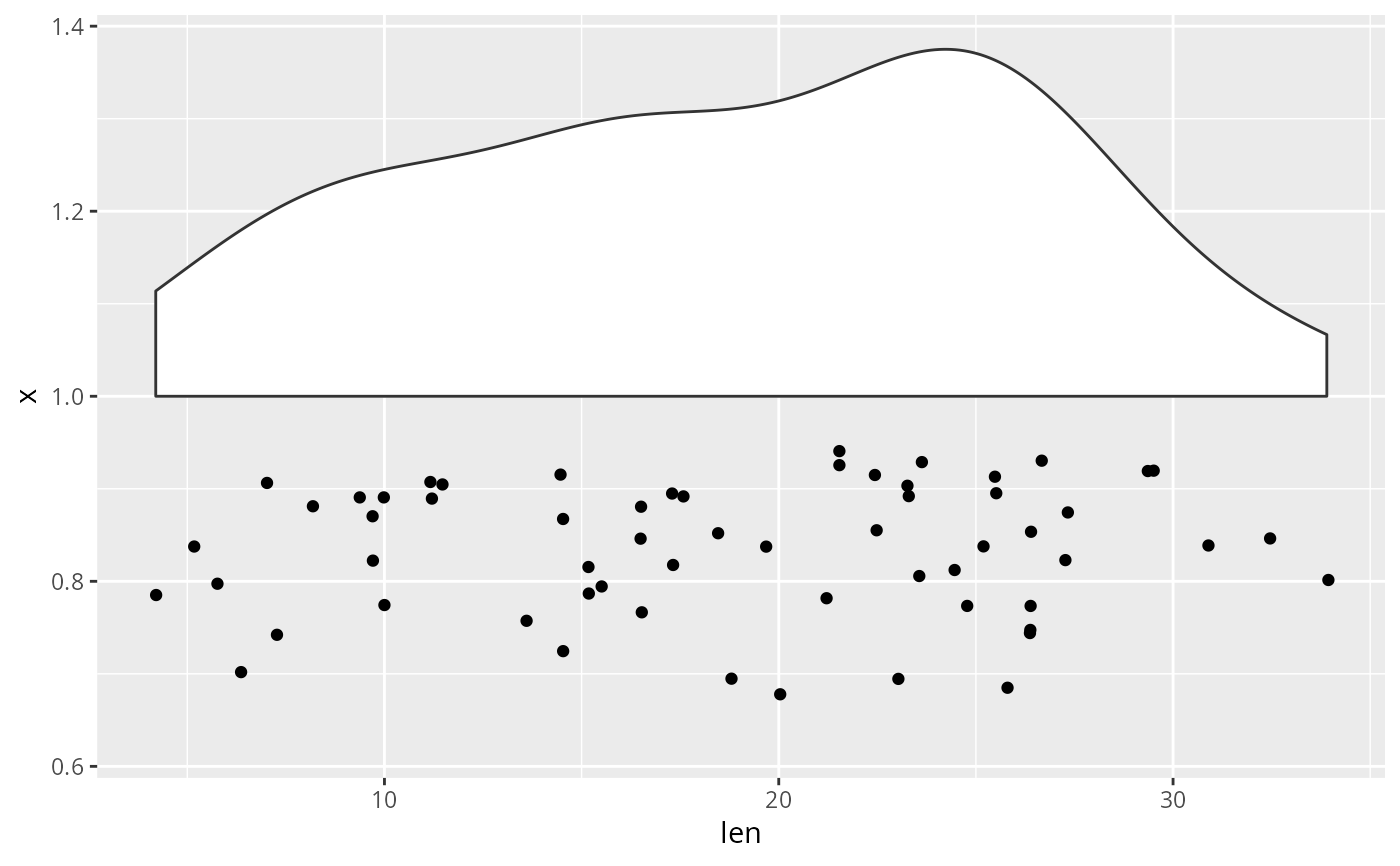
 ggplot(data = ToothGrowth, aes(x = 1, y = len)) +
geom_half_point(aes(y = len), side = "l") +
geom_half_violin(aes(y = len), side = "r") +
coord_flip()
ggplot(data = ToothGrowth, aes(x = 1, y = len)) +
geom_half_point(aes(y = len), side = "l") +
geom_half_violin(aes(y = len), side = "r") +
coord_flip()