Grenander Estimator of a Decreasing or Increasing Density
grenander.RdThe function grenander computes the Grenander estimator
of a one-dimensional decreasing or increasing density.
grenander(F, type=c("decreasing", "increasing"))Arguments
- F
an
ecdfcontaining the empirical cumulative density.- type
specifies whether the distribution is decreasing (the default) or increasing.
Details
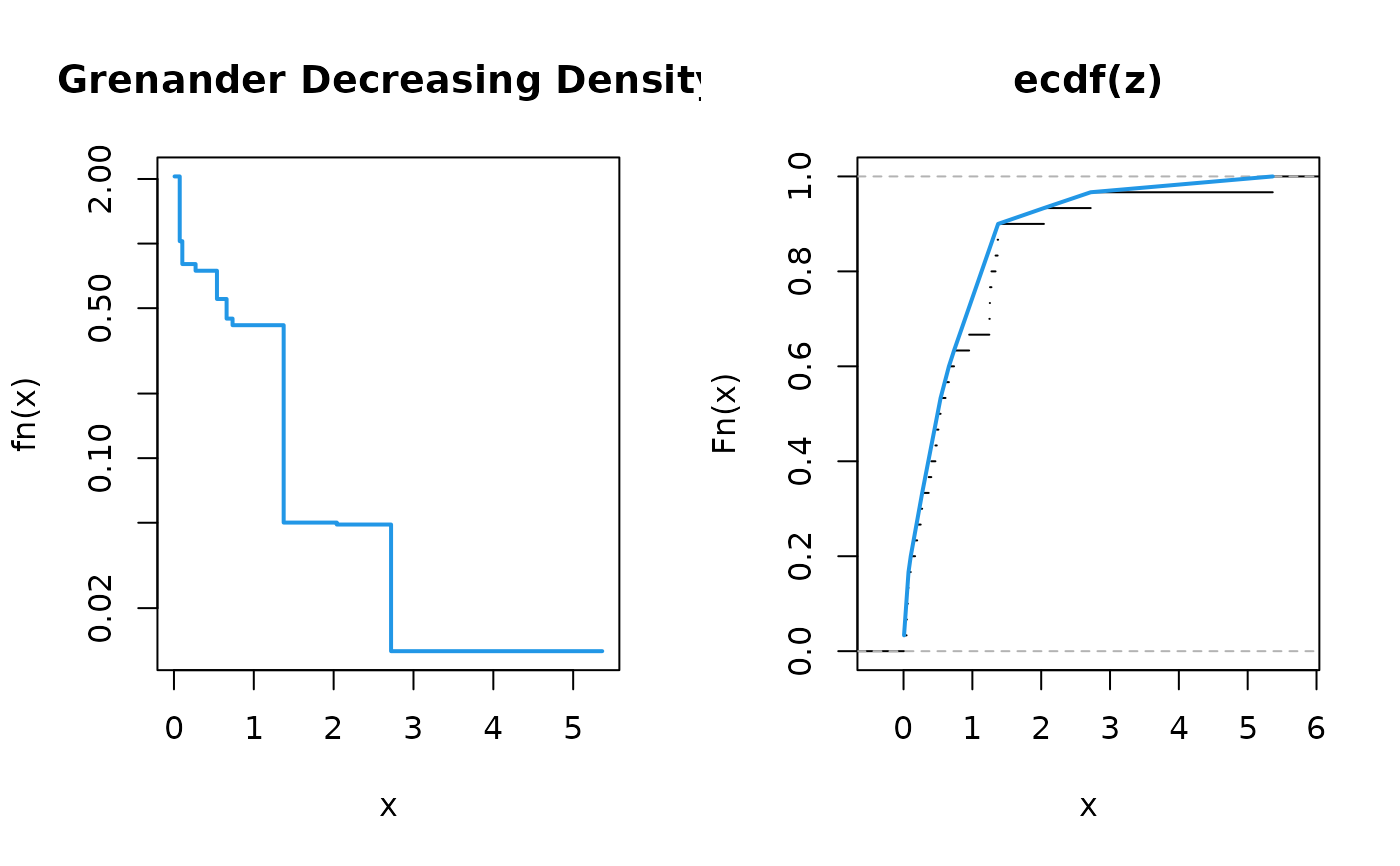
The Grenander (1956) density estimator is given by the slopes of the least concave majorant (LCM) of the empirical distribution function (ECDF). It is a decreasing piecewise-constant function and can be shown to be the non-parametric maximum likelihood estimate (NPMLE) under the assumption of a decreasing density (note that the ECDF is the NPMLE without this assumption). Similarly, an increasing density function is obtained by using the greatest convex minorant (GCM) of the ECDF.
Value
A list of class grenander with the following components:
- F
the empirical distribution function specified as input.
- x.knots
x locations of the knots of the least concave majorant of the ECDF.
- F.knots
the corresponding y locations of the least concave majorant of the ECDF.
- f.knots
the corresponding slopes (=density).
References
Grenander, U. (1956). On the theory of mortality measurement, Part II. Skan. Aktuarietidskr, 39, 125–153.
Examples
# load "fdrtool" library
library("fdrtool")
# samples from random exponential variable
z = rexp(30,1)
e = ecdf(z)
g = grenander(e)
g
#> $F
#> Empirical CDF
#> Call: ecdf(z)
#> x[1:30] = 0.0073775, 0.044101, 0.048439, ..., 2.7192, 5.3642
#>
#> $x.knots
#> [1] 0.007377505 0.072242389 0.104723598 0.270834120 0.538517269 0.659338180
#> [7] 0.733910930 1.374087136 2.039635286 2.719245070 5.364236759
#>
#> $F.knots
#> [1] 0.03333333 0.16666667 0.20000000 0.33333333 0.53333333 0.60000000
#> [7] 0.63333333 0.90000000 0.93333333 0.96666667 1.00000000
#>
#> $f.knots
#> [1] 2.05555494 1.02623437 0.80267843 0.74715200 0.55178087 0.44699080
#> [7] 0.41655198 0.05008403 0.04904775 0.01260243 0.01260243
#>
#> attr(,"class")
#> [1] "grenander"
# plot ecdf, concave cdf, and Grenander density estimator (on log scale)
plot(g, log="y")
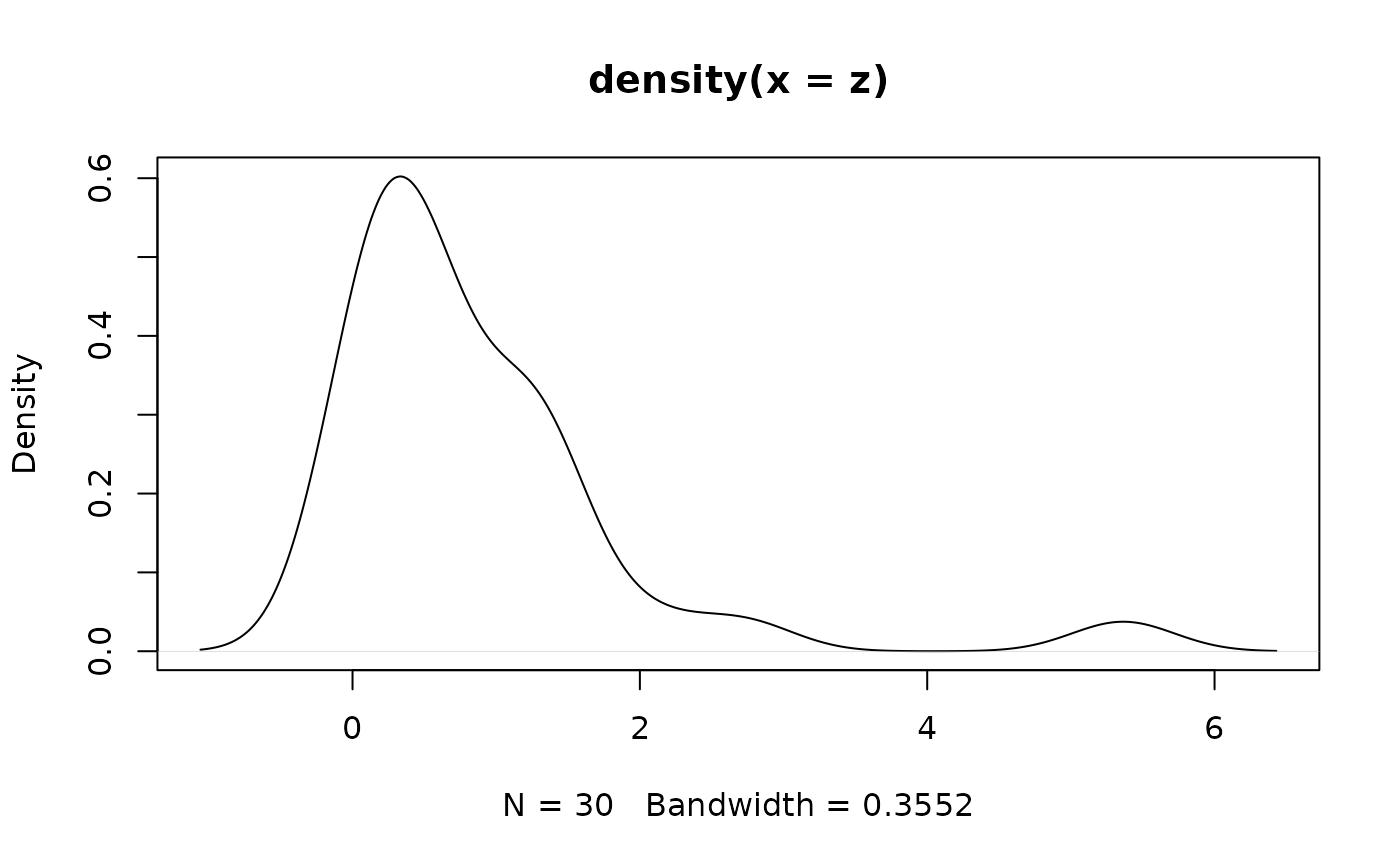
 # for comparison the kernel density estimate
plot(density(z))
# for comparison the kernel density estimate
plot(density(z))
 # area under the Grenander density estimator
sum( g$f.knots[-length(g$f.knots)]*diff(g$x.knots) )
#> [1] 0.9666667
# area under the Grenander density estimator
sum( g$f.knots[-length(g$f.knots)]*diff(g$x.knots) )
#> [1] 0.9666667