Wilcoxon Rank Sum and Signed Rank Tests
wilcox.exact.RdPerforms one and two sample Wilcoxon tests on vectors of data for possibly tied observations.
# Default S3 method
wilcox.exact(x, y = NULL, alternative = c("two.sided", "less", "greater"),
             mu = 0, paired = FALSE, exact = NULL,
             conf.int = FALSE, conf.level = 0.95, ...)
# S3 method for class 'formula'
wilcox.exact(formula, data, subset, na.action, ...)
Arguments
- x
numeric vector of data values.
- y
an optional numeric vector of data values.
- alternative
the alternative hypothesis must be one of
"two.sided"(default),"greater"or"less". You can specify just the initial letter.- mu
a number specifying an optional location parameter.
- paired
a logical indicating whether you want a paired test.
- exact
a logical indicating whether an exact p-value should be computed.
- conf.int
a logical indicating whether a confidence interval should be computed.
- conf.level
confidence level of the interval.
- formula
a formula of the form
lhs ~ rhswherelhsis a numeric variable giving the data values andrhsa factor with two levels giving the corresponding groups.- data
an optional data frame containing the variables in the model formula.
- subset
an optional vector specifying a subset of observations to be used.
- na.action
a function which indicates what should happen when the data contain
NAs. Defaults togetOption("na.action").- ...
further arguments to be passed to or from methods.
Details
This version computes exact conditional (on the data) p-values and quantiles using the Shift-Algorithm by Streitberg & R\"ohmel for both tied and untied samples.
If only x is given, or if both x and y are given
and paired is TRUE, a Wilcoxon signed rank test of the
null that the median of x (in the one sample case) or of
x-y (in the paired two sample case) equals mu is
performed.
Otherwise, if both x and y are given and paired
is FALSE, a Wilcoxon rank sum test (equivalent to the
Mann-Whitney test) is carried out. In this case, the null hypothesis
is that the location of the distributions of x and y
differ by mu.
By default (if exact is not specified), an exact p-value is
computed if the samples contain less than 50 finite values and there
are no ties. Otherwise, a normal approximation is used.
Optionally (if argument conf.int is true), a nonparametric
confidence interval for the median (one-sample case) or for the
difference of the location parameters x-y is computed. If
exact p-values are available, an exact confidence interval is obtained
by the algorithm described in Bauer (1972). Otherwise, an asymptotic
confidence interval is returned.
Value
A list with class "htest" containing the following components:
- statistic
the value of the test statistic with a name describing it.
- p.value
the p-value for the test.
- pointprob
this gives the probability of observing the test statistic itself (called
point-prob).- null.value
the location parameter
mu.- alternative
a character string describing the alternative hypothesis.
- method
the type of test applied.
- data.name
a character string giving the names of the data.
- conf.int
a confidence interval for the location parameter. (Only present if argument
conf.int = TRUE.)- estimate
Hodges-Lehmann estimate of the location parameter. (Only present if argument
conf.int = TRUE.)
References
Myles Hollander & Douglas A. Wolfe (1973), Nonparametric statistical inference. New York: John Wiley & Sons. Pages 27–33 (one-sample), 68–75 (two-sample).
David F. Bauer (1972), Constructing confidence sets using rank statistics. Journal of the American Statistical Association 67, 687–690.
Cyrus R. Mehta & Nitin R. Patel (2001), StatXact-5 for Windows. Manual, Cytel Software Cooperation, Cambridge, USA
See also
perm.test for the one and two sample permutation test.
Examples
## One-sample test.
## Hollander & Wolfe (1973), 29f.
## Hamilton depression scale factor measurements in 9 patients with
## mixed anxiety and depression, taken at the first (x) and second
## (y) visit after initiation of a therapy (administration of a
## tranquilizer).
x <- c(1.83, 0.50, 1.62, 2.48, 1.68, 1.88, 1.55, 3.06, 1.30)
y <- c(0.878, 0.647, 0.598, 2.05, 1.06, 1.29, 1.06, 3.14, 1.29)
wilcox.exact(x, y, paired = TRUE, alternative = "greater")
#>
#> Exact Wilcoxon signed rank test
#>
#> data: x and y
#> V = 40, p-value = 0.01953
#> alternative hypothesis: true mu is greater than 0
#>
wilcox.exact(y - x, alternative = "less") # The same.
#>
#> Exact Wilcoxon signed rank test
#>
#> data: y - x
#> V = 5, p-value = 0.01953
#> alternative hypothesis: true mu is less than 0
#>
## Two-sample test.
## Hollander & Wolfe (1973), 69f.
## Permeability constants of the human chorioamnion (a placental
## membrane) at term (x) and between 12 to 26 weeks gestational
## age (y). The alternative of interest is greater permeability
## of the human chorioamnion for the term pregnancy.
x <- c(0.80, 0.83, 1.89, 1.04, 1.45, 1.38, 1.91, 1.64, 0.73, 1.46)
y <- c(1.15, 0.88, 0.90, 0.74, 1.21)
wilcox.exact(x, y, alternative = "g") # greater
#>
#> Exact Wilcoxon rank sum test
#>
#> data: x and y
#> W = 35, p-value = 0.1272
#> alternative hypothesis: true mu is greater than 0
#>
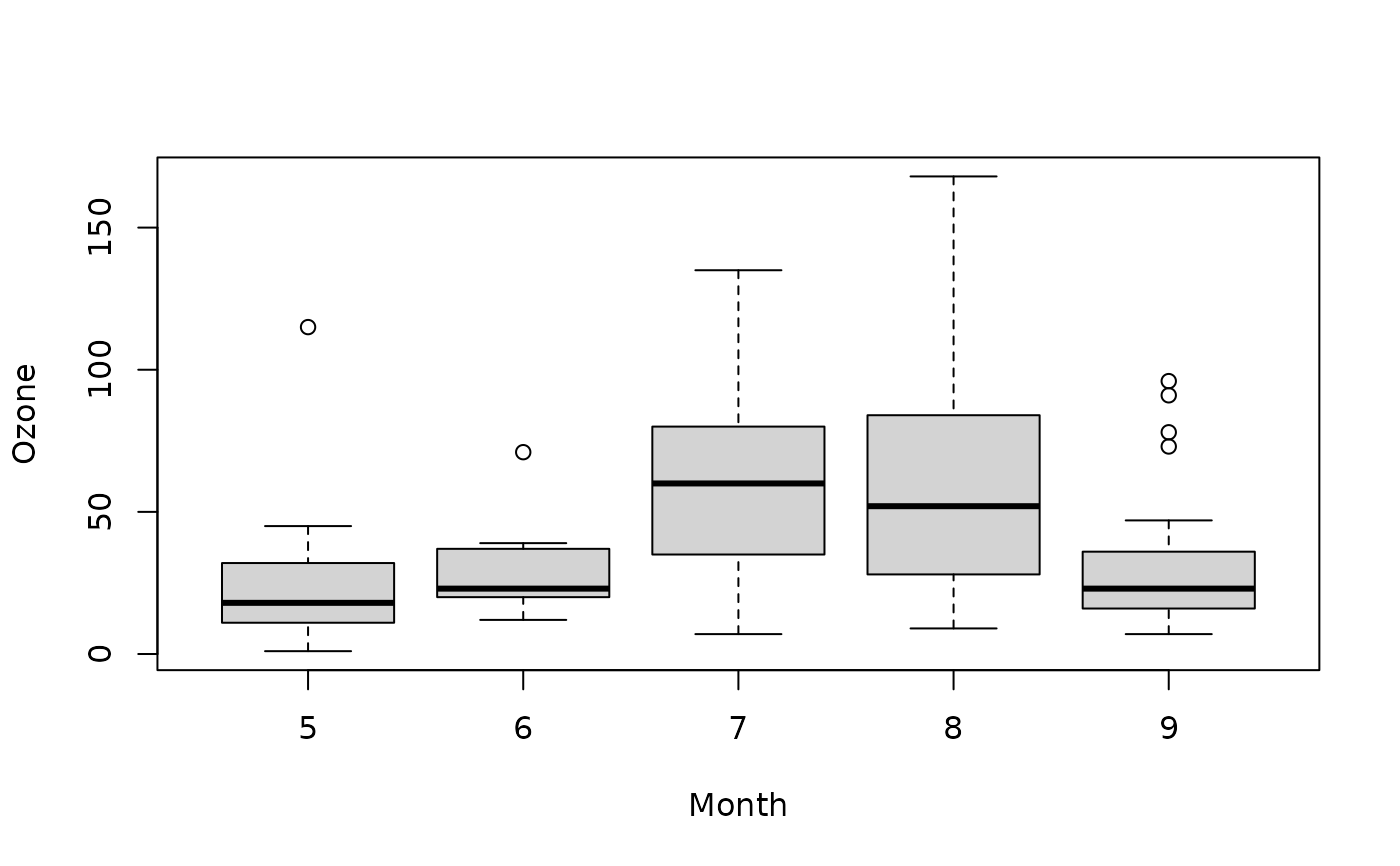
## Formula interface.
data(airquality)
boxplot(Ozone ~ Month, data = airquality)
 wilcox.exact(Ozone ~ Month, data = airquality,
subset = Month %in% c(5, 8))
#>
#> Exact Wilcoxon rank sum test
#>
#> data: Ozone by Month
#> W = 127.5, p-value = 6.109e-05
#> alternative hypothesis: true mu is not equal to 0
#>
# Hollander & Wolfe, p. 39, results p. 40 and p. 53
x <- c(1.83, 0.50, 1.62, 2.48, 1.68, 1.88, 1.55, 3.06, 1.30)
y <- c(0.878, 0.647, 0.598, 2.05, 1.06, 1.29, 1.06, 3.14, 1.29)
wilcox.exact(y,x, paired=TRUE, conf.int=TRUE)
#>
#> Exact Wilcoxon signed rank test
#>
#> data: y and x
#> V = 5, p-value = 0.03906
#> alternative hypothesis: true mu is not equal to 0
#> 95 percent confidence interval:
#> -0.786 -0.010
#> sample estimates:
#> (pseudo)median
#> -0.46
#>
# Hollander & Wolfe, p. 110, results p. 111 and p. 126
x <- c(0.8, 0.83, 1.89, 1.04, 1.45, 1.38, 1.91, 1.64, 0.73, 1.46)
y <- c(1.15, 0.88, 0.90, 0.74, 1.21)
wilcox.exact(y,x, conf.int=TRUE)
#>
#> Exact Wilcoxon rank sum test
#>
#> data: y and x
#> W = 15, p-value = 0.2544
#> alternative hypothesis: true mu is not equal to 0
#> 95 percent confidence interval:
#> -0.76 0.15
#> sample estimates:
#> difference in location
#> -0.305
#>
wilcox.exact(Ozone ~ Month, data = airquality,
subset = Month %in% c(5, 8))
#>
#> Exact Wilcoxon rank sum test
#>
#> data: Ozone by Month
#> W = 127.5, p-value = 6.109e-05
#> alternative hypothesis: true mu is not equal to 0
#>
# Hollander & Wolfe, p. 39, results p. 40 and p. 53
x <- c(1.83, 0.50, 1.62, 2.48, 1.68, 1.88, 1.55, 3.06, 1.30)
y <- c(0.878, 0.647, 0.598, 2.05, 1.06, 1.29, 1.06, 3.14, 1.29)
wilcox.exact(y,x, paired=TRUE, conf.int=TRUE)
#>
#> Exact Wilcoxon signed rank test
#>
#> data: y and x
#> V = 5, p-value = 0.03906
#> alternative hypothesis: true mu is not equal to 0
#> 95 percent confidence interval:
#> -0.786 -0.010
#> sample estimates:
#> (pseudo)median
#> -0.46
#>
# Hollander & Wolfe, p. 110, results p. 111 and p. 126
x <- c(0.8, 0.83, 1.89, 1.04, 1.45, 1.38, 1.91, 1.64, 0.73, 1.46)
y <- c(1.15, 0.88, 0.90, 0.74, 1.21)
wilcox.exact(y,x, conf.int=TRUE)
#>
#> Exact Wilcoxon rank sum test
#>
#> data: y and x
#> W = 15, p-value = 0.2544
#> alternative hypothesis: true mu is not equal to 0
#> 95 percent confidence interval:
#> -0.76 0.15
#> sample estimates:
#> difference in location
#> -0.305
#>