Plot Tuning Object
plot.tune.RdVisualizes the results of parameter tuning.
# S3 method for class 'tune'
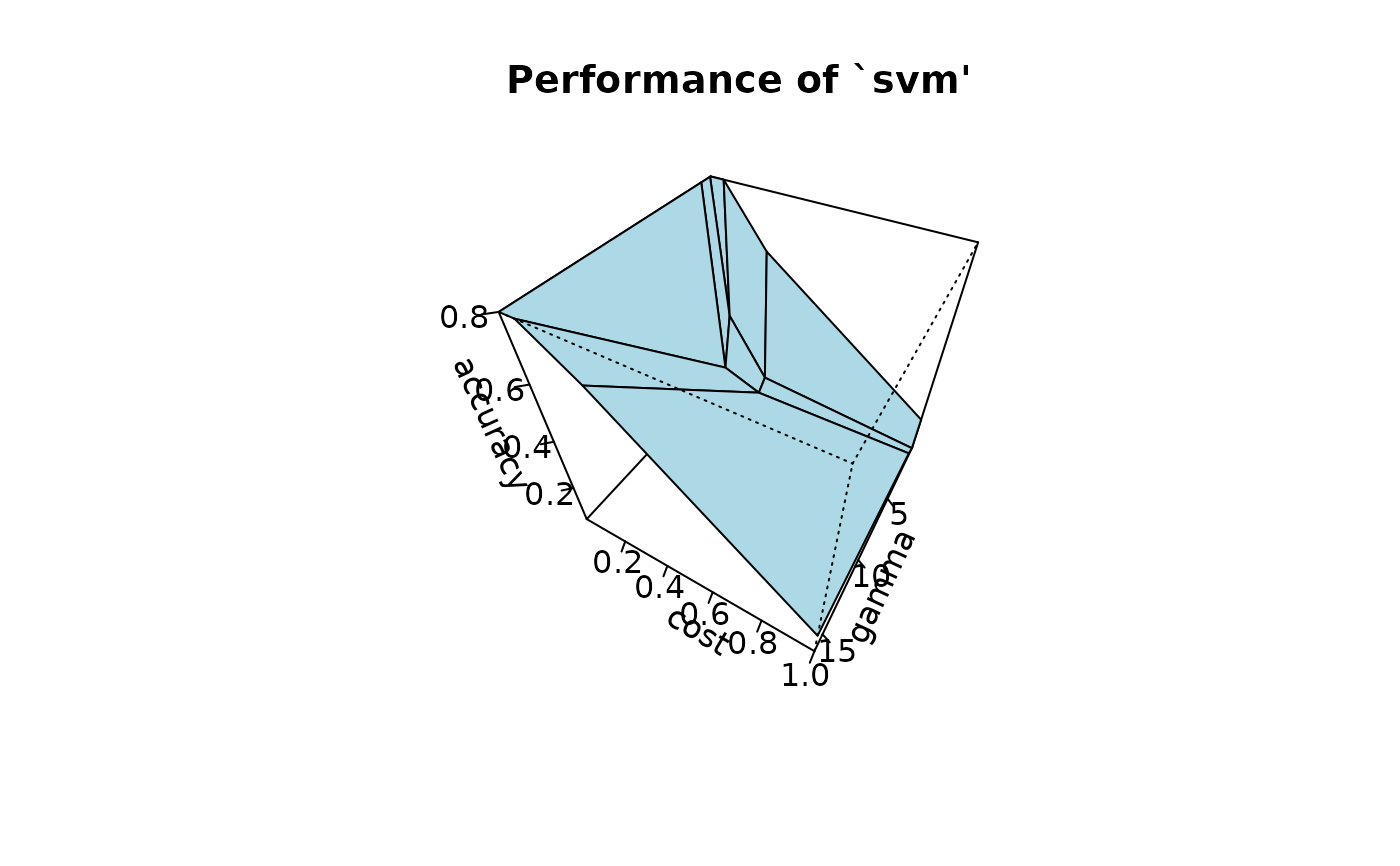
plot(x, type = c("contour", "perspective"), theta = 60,
col = "lightblue", main = NULL, xlab = NULL, ylab = NULL,
swapxy = FALSE, transform.x = NULL, transform.y = NULL,
transform.z = NULL, color.palette = hsv_palette(),
nlevels = 20, ...)Arguments
- x
an object of class
tune- type
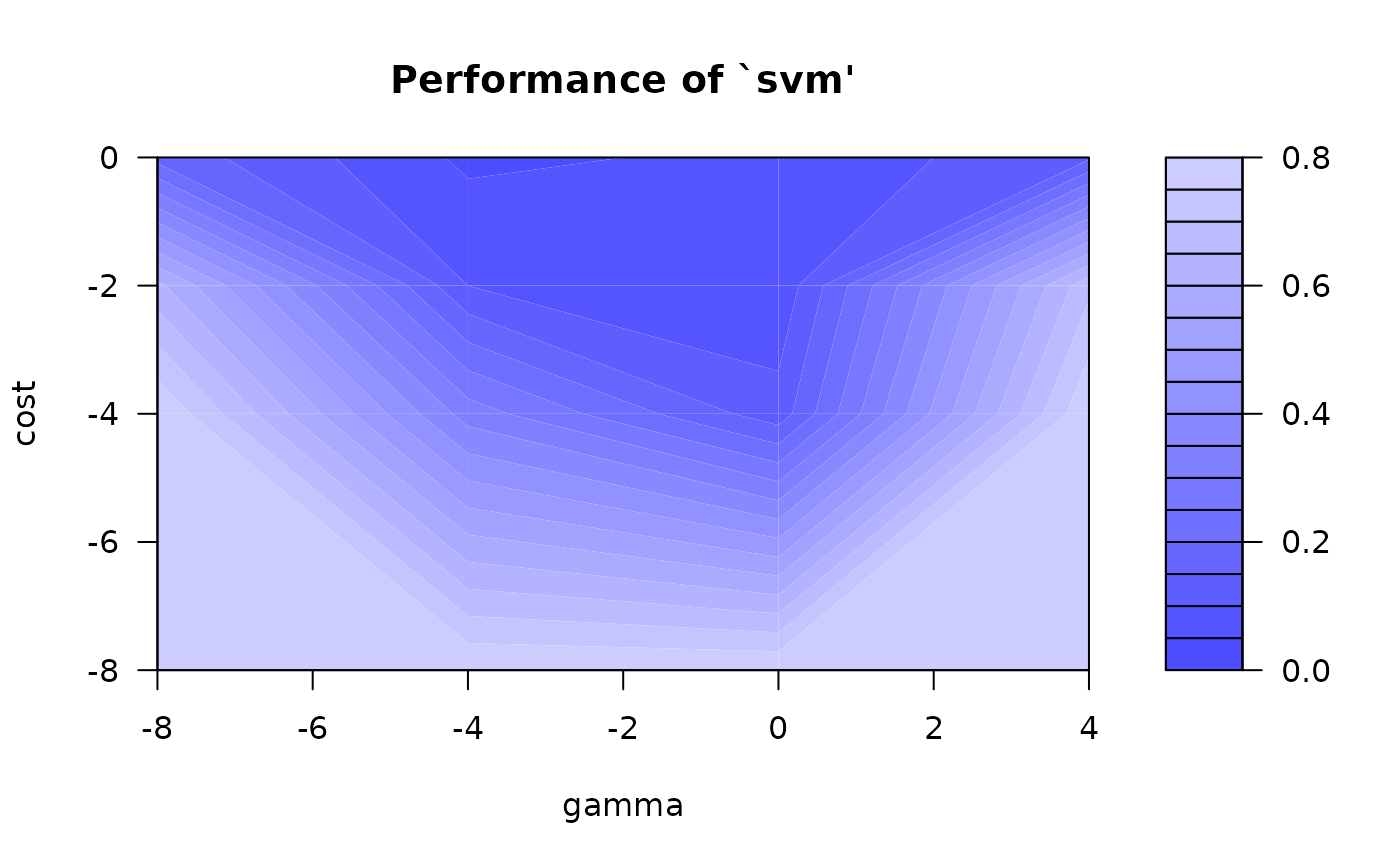
choose whether a contour plot or a perspective plot is used if two parameters are to be visualized. Ignored if only one parameter has been tuned.
- theta
angle of azimuthal direction.
- col
the color(s) of the surface facets. Transparent colors are ignored.
- main
main title
- xlab, ylab
titles for the axes. N.B. These must be character strings; expressions are not accepted. Numbers will be coerced to character strings.
- swapxy
if
TRUE, the parameter axes are swaped (only used in case of two parameters).- transform.x, transform.y, transform.z
functions to transform the parameters (
xandy) and the error measures (z). Ignored ifNULL.- color.palette
color palette used in contour plot.
- nlevels
number of levels used in contour plot.
- ...
Further graphics parameters.