Plot Short Time Fourier Transforms
plot.stft.RdAn object of class "stft" is plotted as a gray scale image.
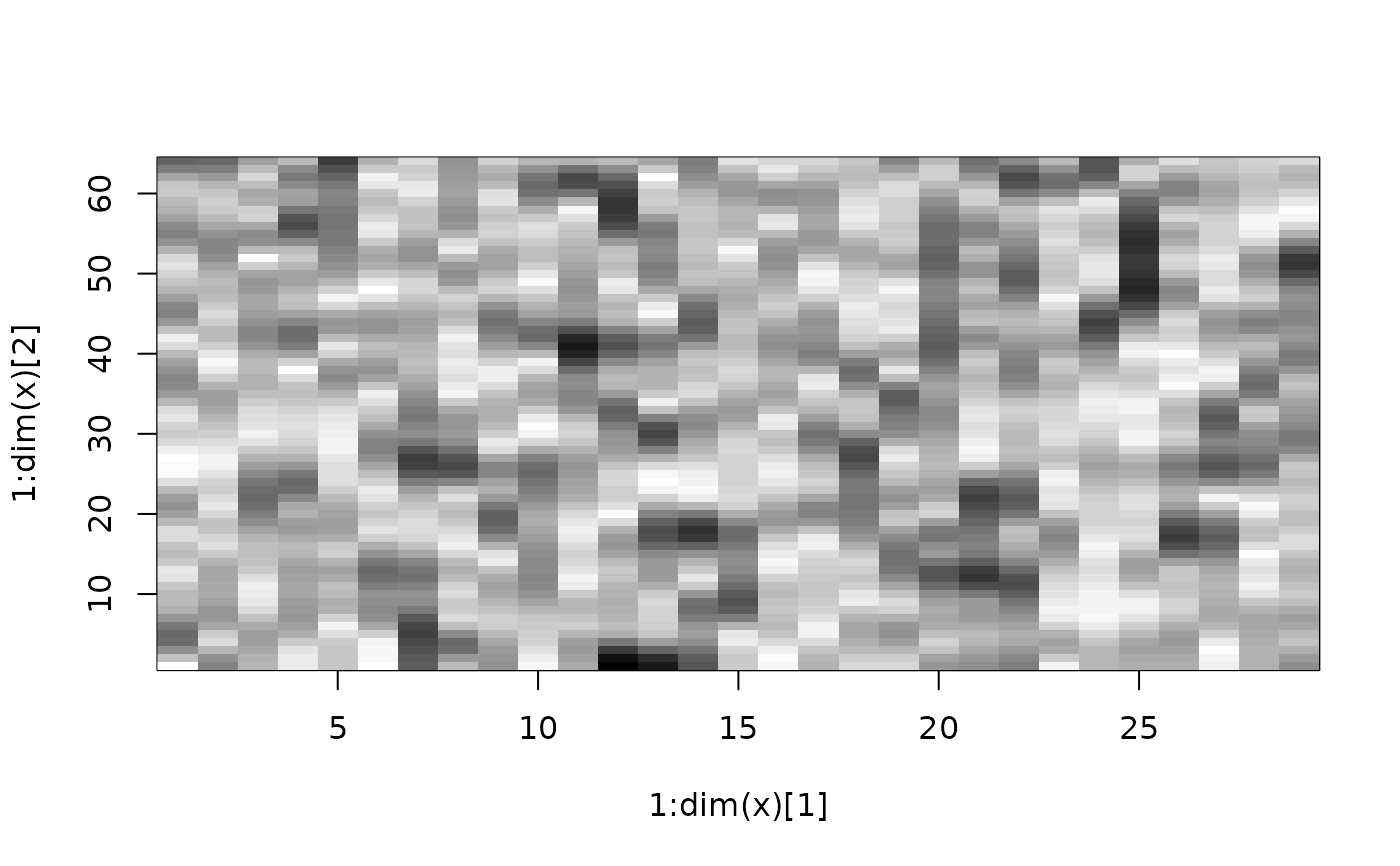
The x-axis corresponds to time, the y-axis to frequency. If the
default colormap is used, dark regions in the plot correspond to high
values at the particular time/frequency location.
Arguments
Value
No return value. This function is only for plotting.
See also
stft