coordinates of elements on a plot
coordinates.Rdestimates coordinates of elements, neatly arranged on a plot.
coordinates(pos = NULL, mx = 0.0, my = 0.0, N = length(pos),
            hor = TRUE, relsize = 1)
Arguments
- pos
vector specifying the number of elements in each row, or 2-columned matrix with element position, or
NULL.- mx
horizontal shift (x).
- my
vertical shift (y).
- N
total number of elements to be positioned - only if pos=
NULL.- hor
only if
posis a 2-columned matrix. In this case, whenhor = TRUE,posspecifies number of elements per row; whenFALSEper column.- relsize
scaling factor as a function of graph size.
Value
2-columned matrix, with coordinates (x,y) of each of the elements
Details
the position of the elements are specified with pos, which is
either NULL, or a vector specifying the number of elements on a row,
or a 2-columned matrix specifying the (x,y) position of each element.
when
posisNULL, the elements will be arranged on a circle; in this case, the number of elements to be positioned must be specified withN.when
posis a vector, it specifies the number of elements in each row (ifhor =TRUE) or in each column (ifhor = FALSE).For instance, with
hor=TRUEandpos = c(3,2,1)the elements will be arranged in 3 rows (length of vector); on the top row 3 elements; on the second row 2; and on the third row 1 element will be positioned. All elements within a row are equally distributed horizontally; all rows are equally distributed vertically;when
posis a matrix, it specifies the x(1st column) and y(2nd column) position of each element and is returned as such.
The offset from the x-axis and from the y-axis can be changed with
mx and my.
Examples
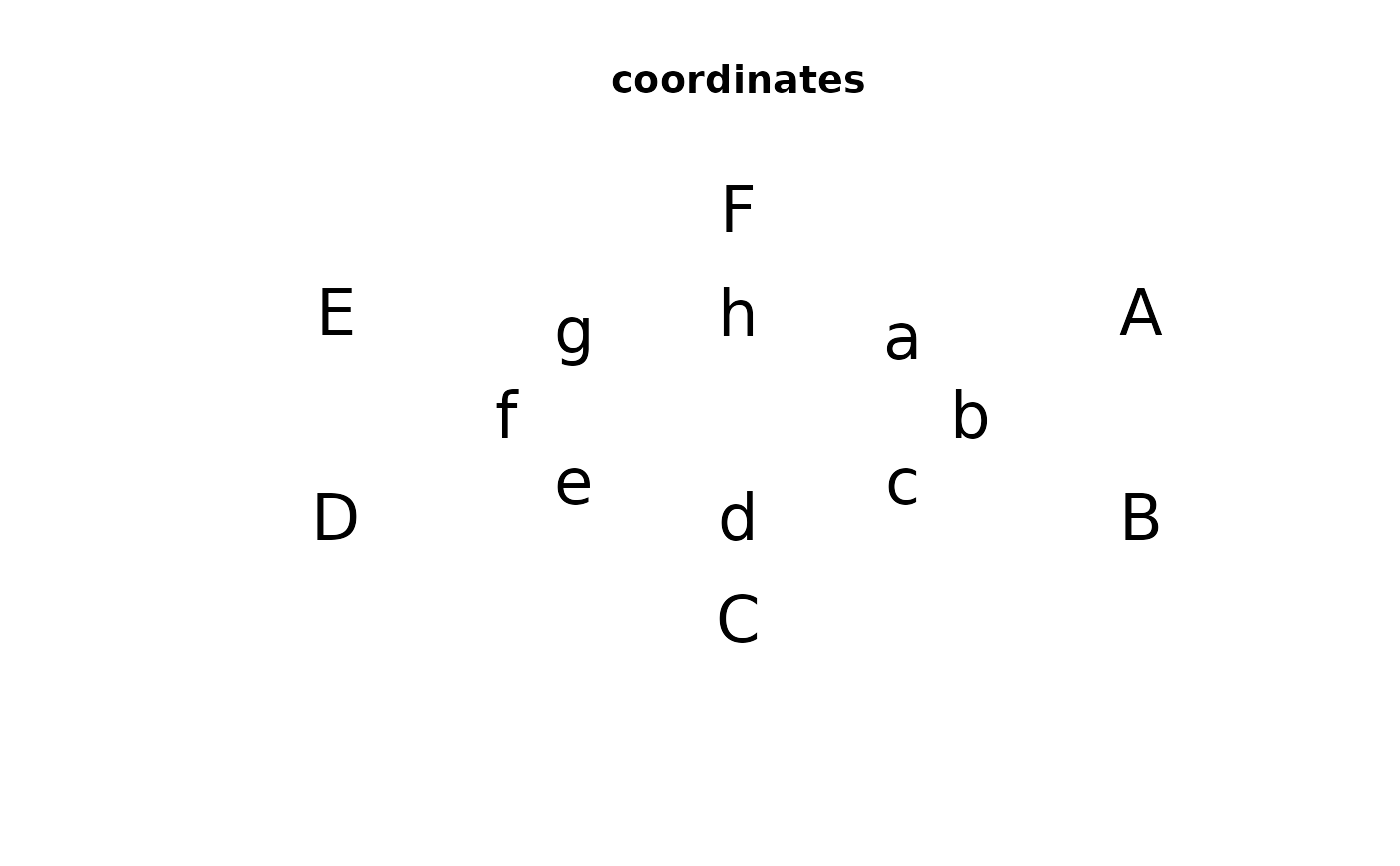
openplotmat(main = "coordinates")
text(coordinates(N = 6), lab = LETTERS[1:6], cex = 2)
text(coordinates(N = 8, relsize = 0.5), lab = letters[1:8], cex = 2)
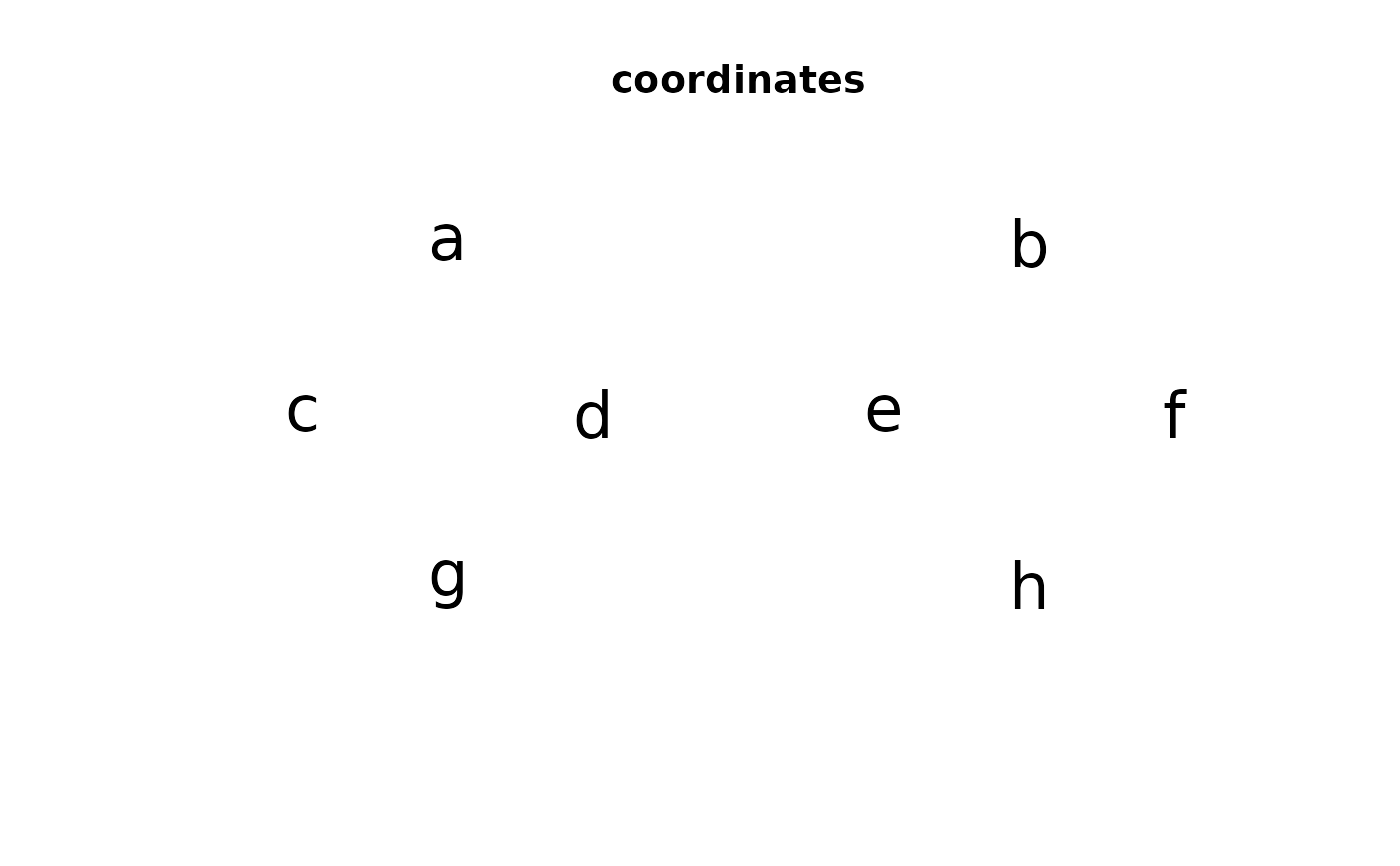
 openplotmat(main = "coordinates")
text(coordinates(pos = c(2, 4, 2)), lab = letters[1:8], cex = 2)
openplotmat(main = "coordinates")
text(coordinates(pos = c(2, 4, 2)), lab = letters[1:8], cex = 2)
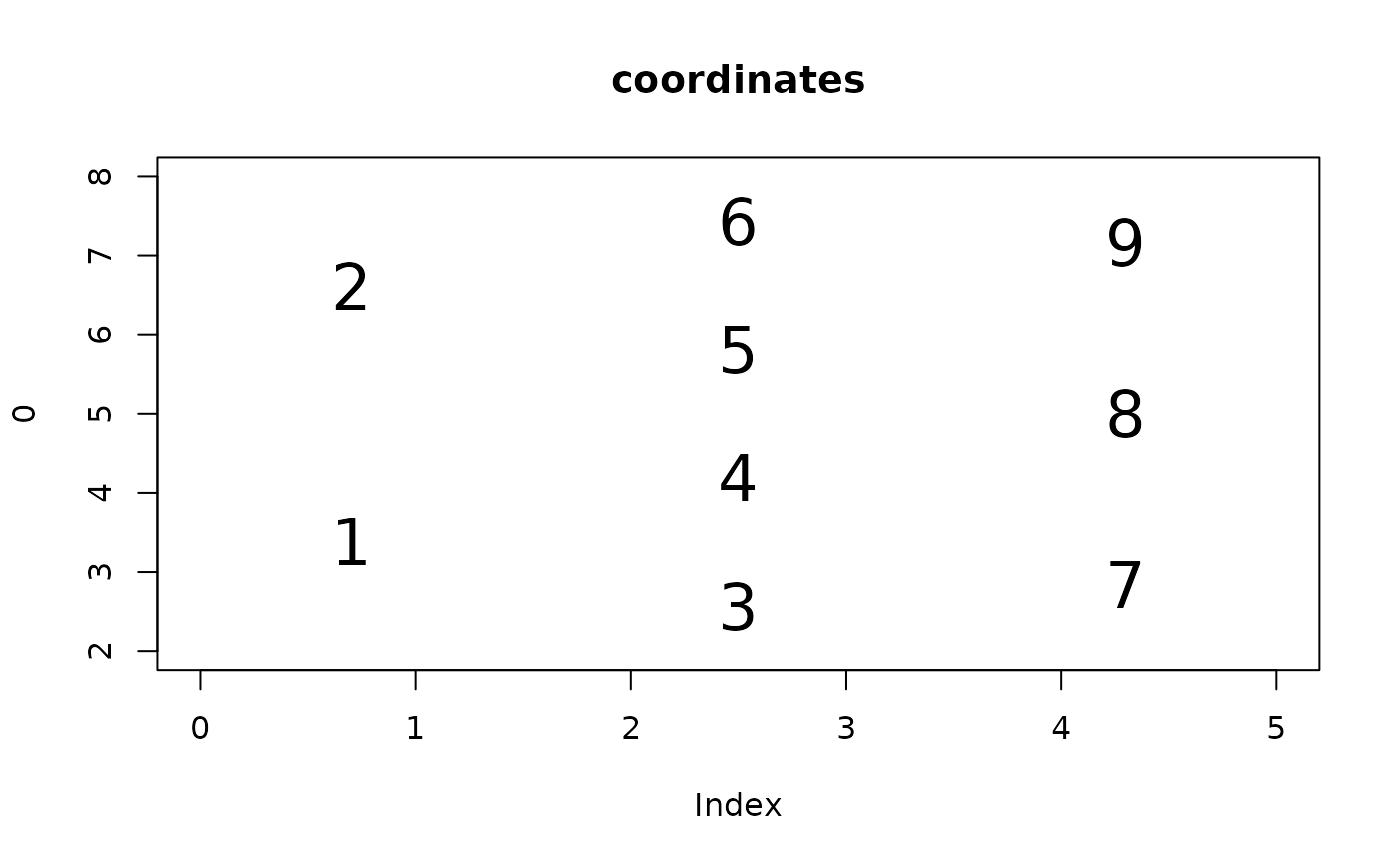
 plot(0, type = "n", xlim = c(0, 5), ylim = c(2, 8), main = "coordinates")
text(coordinates(pos = c(2, 4, 3), hor = FALSE), lab = 1:9, cex = 2)
plot(0, type = "n", xlim = c(0, 5), ylim = c(2, 8), main = "coordinates")
text(coordinates(pos = c(2, 4, 3), hor = FALSE), lab = 1:9, cex = 2)