Plot objects produced by deldir
plot.deldir.RdThis is a method for plot.
Arguments
- x
An object of class "deldir" as returned by the function deldir.
- add
logical argument; should the plot be added to an existing plot?
- wlines
"which lines?". I.e. should the Delaunay triangulation be plotted (wlines="triang"), should the Dirichlet tessellation be plotted (wlines="tess"), or should both be plotted (wlines="both", the default) ?
- showpoints
Logical scalar; should the points being triangulated/tessellated be plotted?
- labelPts
Logical argument, defaulting to
FALSE; ifTRUEthen the points plotted will be labelled with their identifiers (as specified by the optional argumentidofdeldir(). Ifidwas not specified todeldir(), then the identifiers default to the indices of the points, which correspond to the row numbers of the matrix "summary" in the output ofdeldir()).- cex
The value of the character expansion argument cex to be used with the plotting symbols for plotting the points.
- lex
The value of the character expansion argument cex to be used by the text function when labelling the points with their identifiers. Used only if
labelPtsisTRUE.- cmpnt_col
A vector or list specifying the colours to be used for plotting the (up to five) different components of the graphic, explicitly the triangulation, the tessellation, the data points, the point labels and the enclosing rectangle (
x$rw) in that order. The components of this vector or list may be named, with the names chosen from"tri","tess","points","labels","rect".The default isc(tri=1,tess=1,points=1,labels=1,rect=1). If the vector or list is not named, the component names are assumed to be from the default list of names in the given order.Colours may be specified as positive integers, corresponding to the entries of the current
palette(), or as names of colours (from the list given bycolors()), or in terms of their RGB components with strings of the form"#RRGGBB". (See Color Specification inpar().)If fewer than five colours are given, the missing components are filled in with
1orpalette()[1]as is appropriate. Ifcmpnt_coldoes not have names then the components are simply recycled. If more than five colours are given, the redundant ones are ignored (i.e. only the first five are used).- cmpnt_lty
A vector or list (of length two) of line types for plotting the two components of the graphic that consist of lines, i.e. the triangulation and the tessellation. The types may consist of integers between 1 and 6, or of approriate text strings ("solid", "dashed", "dotted", "dotdash", "longdash" or "twodash"; see the discussion of
ltyinpar()). The components ofcmpnt_lty(vector or list) may have names ("tri","tess"). The default is c(tri=1,tess=2). If a single value is given, the missing one is filled in as1or"solid"as is appropriate. If more than two values are given, the redundant ones are ignored, i.e. only the first two are used.- pch
The plotting symbol for plotting the points. May be either integer or character.
- xlim
The limits on the x-axis. Defaults to
rw[1:2]whererwis the rectangular window specification returned by deldir().- ylim
The limits on the y-axis. Defaults to
rw[3:4]whererwis the rectangular window specification returned by deldir().- axes
Logical scalar. Should axes be drawn on the plot?
- xlab
Label for the x-axis. Defaults to
xifaxesisTRUEand to the empty string ifaxesisFALSE. Ignored ifadd=TRUE.- ylab
Label for the y-axis. Defaults to
yifaxesisTRUEand to the empty string ifaxesisFALSE. Ignored ifadd=TRUE.- showrect
Logical scalar; show the enclosing rectangle
rw(seedeldir()) be plotted?- asp
The aspect ratio of the plot; integer scalar or
NA. Set this argument equal toNAto allow the data to determine the aspect ratio and hence to make the plot occupy the complete plotting region in bothxandydirections. This is inadvisable; see the Warning. Theaspargument is ignored ifaddisTRUE.- ...
Further plotting parameters (e.g.
lw,col) to be passed tosegments(). (Conceivably one might also use...to supply additional arguments to be passed topoints()ortext()but this is unlikely.) Note that ifcolis specified as one of the...arguments then this is used as thecolargument ofsegments(and the values ofcmpnt_col[1:2]are ignored.
Side Effects
A plot of the edges of the Delaunay triangles and/or of the Dirichlet tiles is produced or added to an existing plot. By default the triangles are plotted with solid lines (lty=1) and the tiles with dotted lines (lty=2). In addition the points being triangulated may be plotted.
Warnings
As of release 1.0-8 the argument
numberofplot.deldir()andplot.tile.list()was changed tolabelPts. As a consequence the argumentnexof this function has had its name changed tolex.In previous versions of the
deldirpackage, the aspect ratio was not set. Instead, the shape of the plotting region was set to be square (pty="s"). This practice was suboptimal. To reproduce previous behaviour setasp=NA(and possiblypty="s") in the call toplot.deldir(). Users, unless they really understand what they are doing and why they are doing it, are now strongly advised not to set the value ofaspbut rather to leaveaspequal to its default value of1. Any other value may distort the tessellation and destroy the perpendicular appearance of lines which are indeed perpendicular. (And conversely may cause lines which are not perpendicular to appear as if they are.)
See also
deldir()
Examples
x <- c(2.3,3.0,7.0,1.0,3.0,8.0) + 0.5
y <- c(2.3,3.0,2.0,5.0,8.0,9.0) + 0.5
x <- c(x,1,10,10,1)
y <- c(y,1,1,10,10)
dxy <- deldir(x,y,rw=c(0,11,0,11))
plot(dxy)
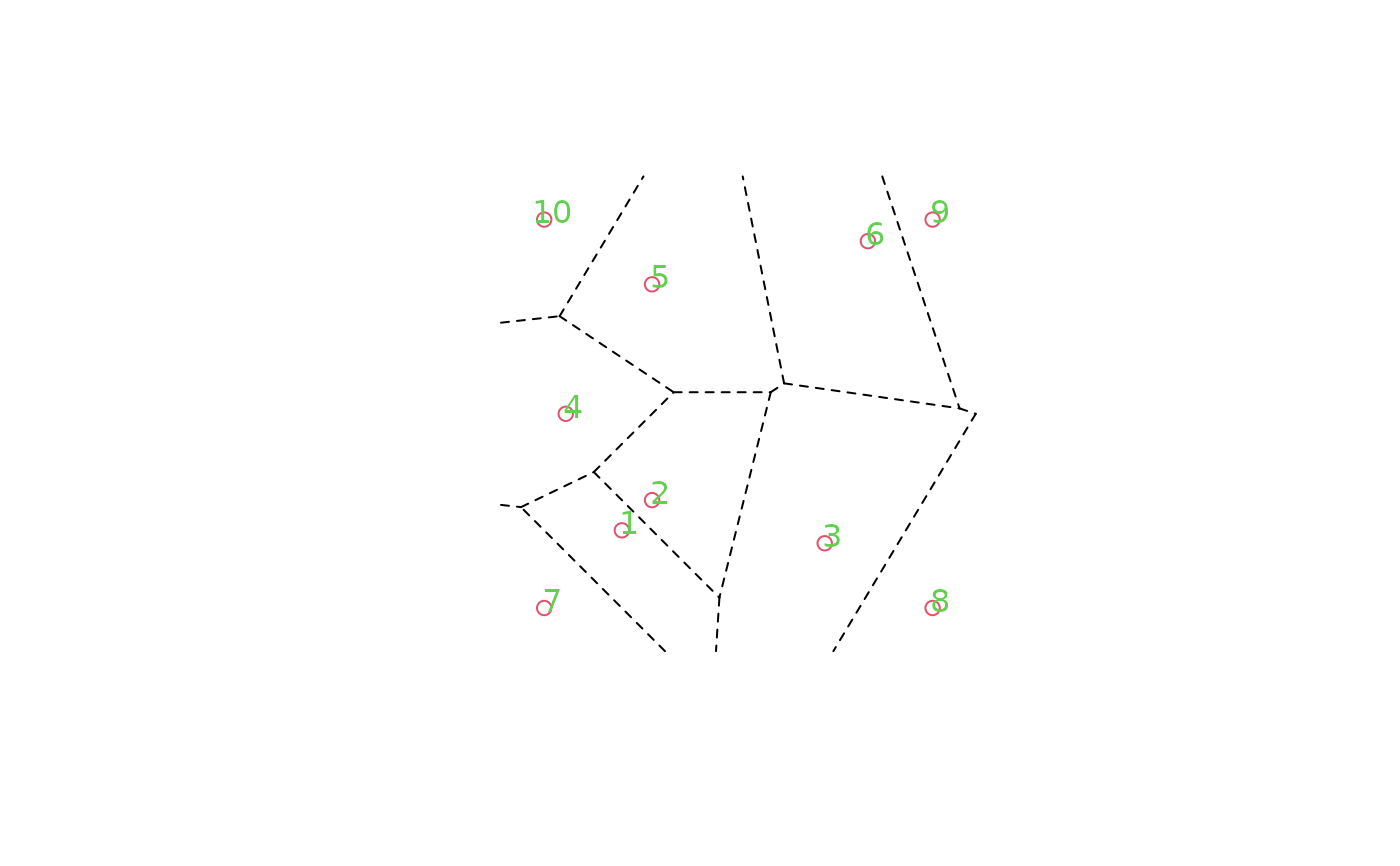
 # Plots the tessellation, but does not save the results:
deldir(x,y,rw=c(0,11,0,11),plot=TRUE,
wl="tess",cmpnt_col=c(1,1,2,3,4),labelPts=TRUE)
# Plots the tessellation, but does not save the results:
deldir(x,y,rw=c(0,11,0,11),plot=TRUE,
wl="tess",cmpnt_col=c(1,1,2,3,4),labelPts=TRUE)
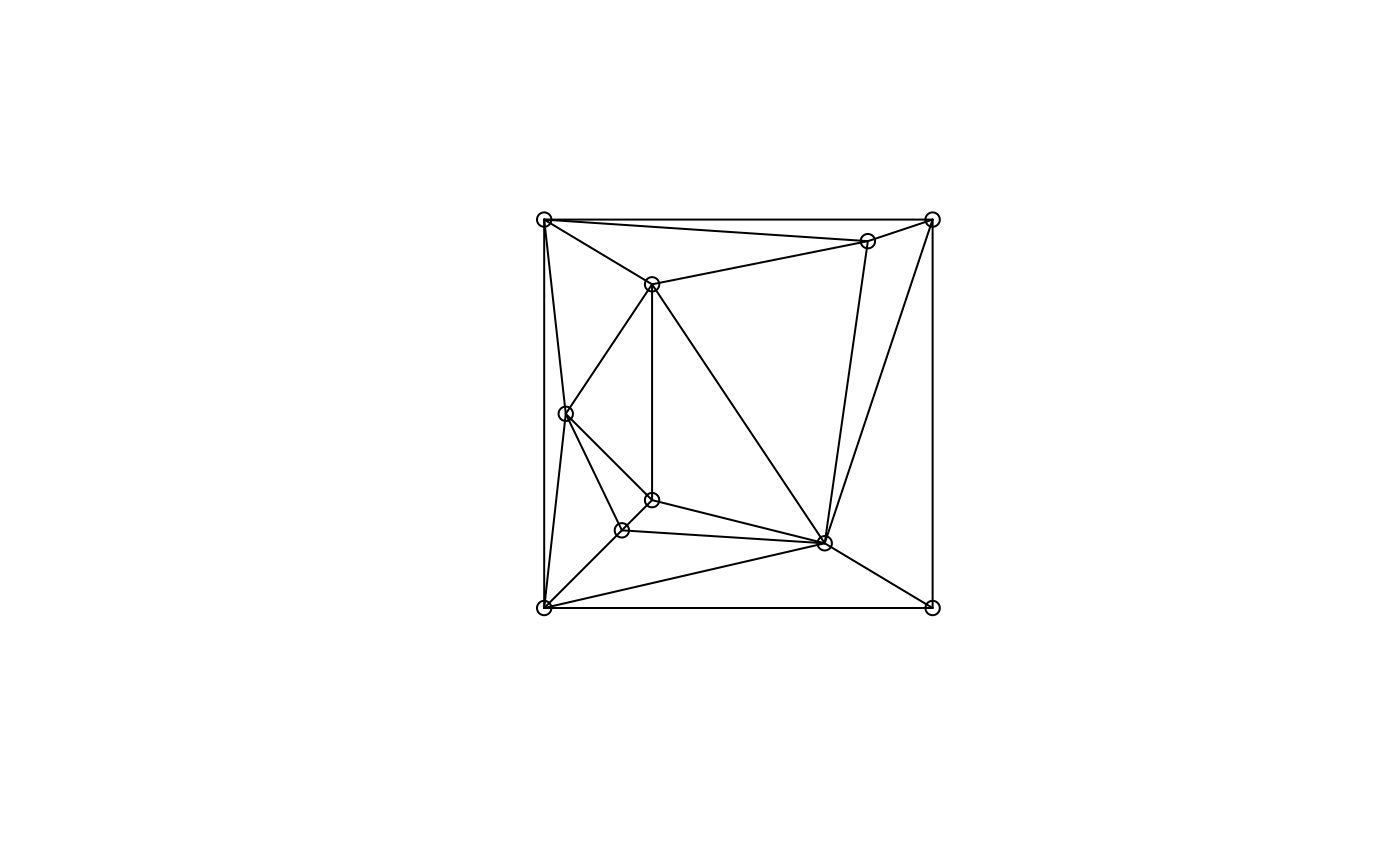
 # Plots the triangulation, but not the tessellation or the points,
# and saves the returned structure:
dxy <- deldir(x,y,rw=c(0,11,0,11),plot=TRUE,wl="triang",wp="none")
#> Warning: "wp" is not a graphical parameter
#> Warning: "wp" is not a graphical parameter
# Plots the triangulation, but not the tessellation or the points,
# and saves the returned structure:
dxy <- deldir(x,y,rw=c(0,11,0,11),plot=TRUE,wl="triang",wp="none")
#> Warning: "wp" is not a graphical parameter
#> Warning: "wp" is not a graphical parameter
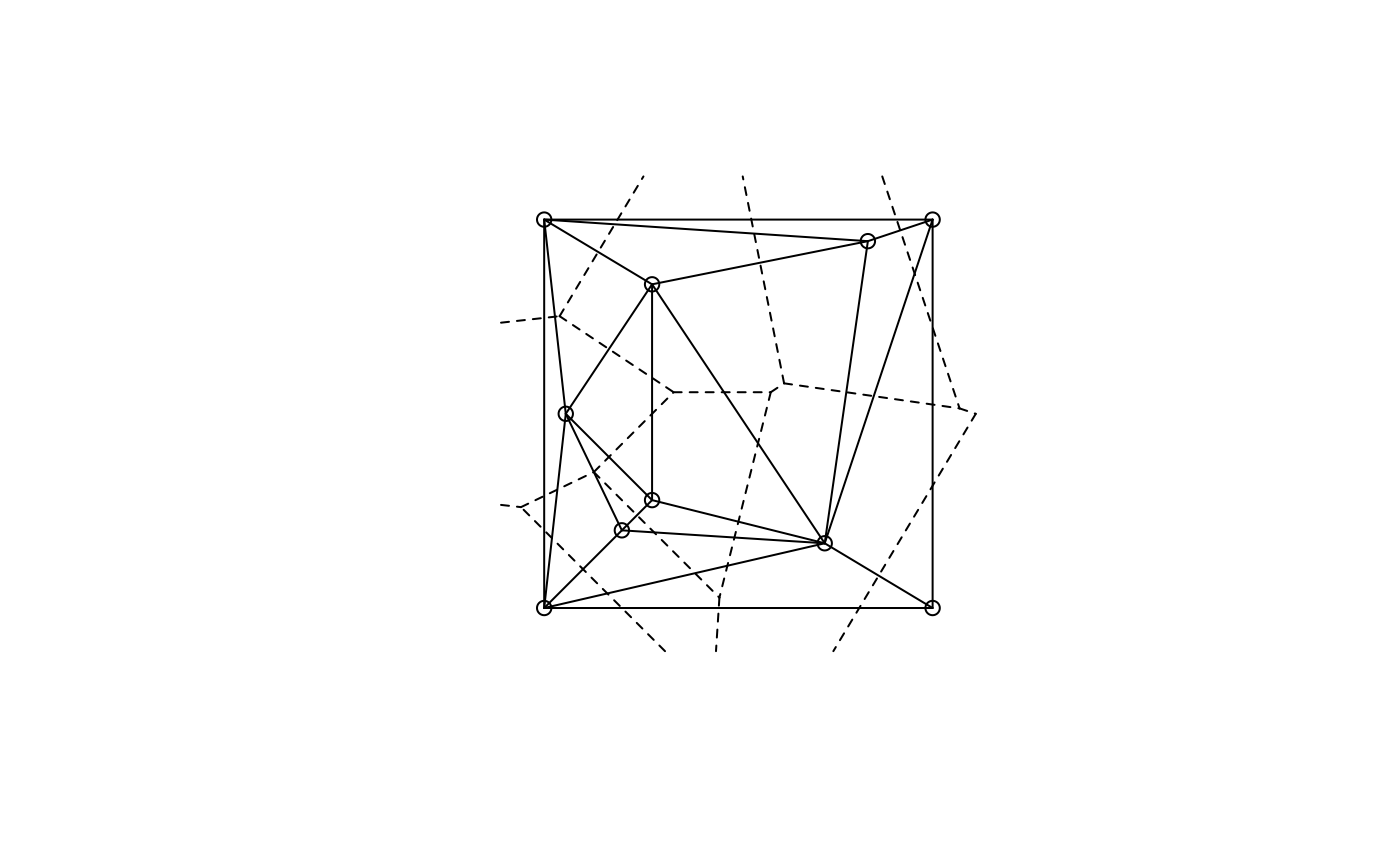
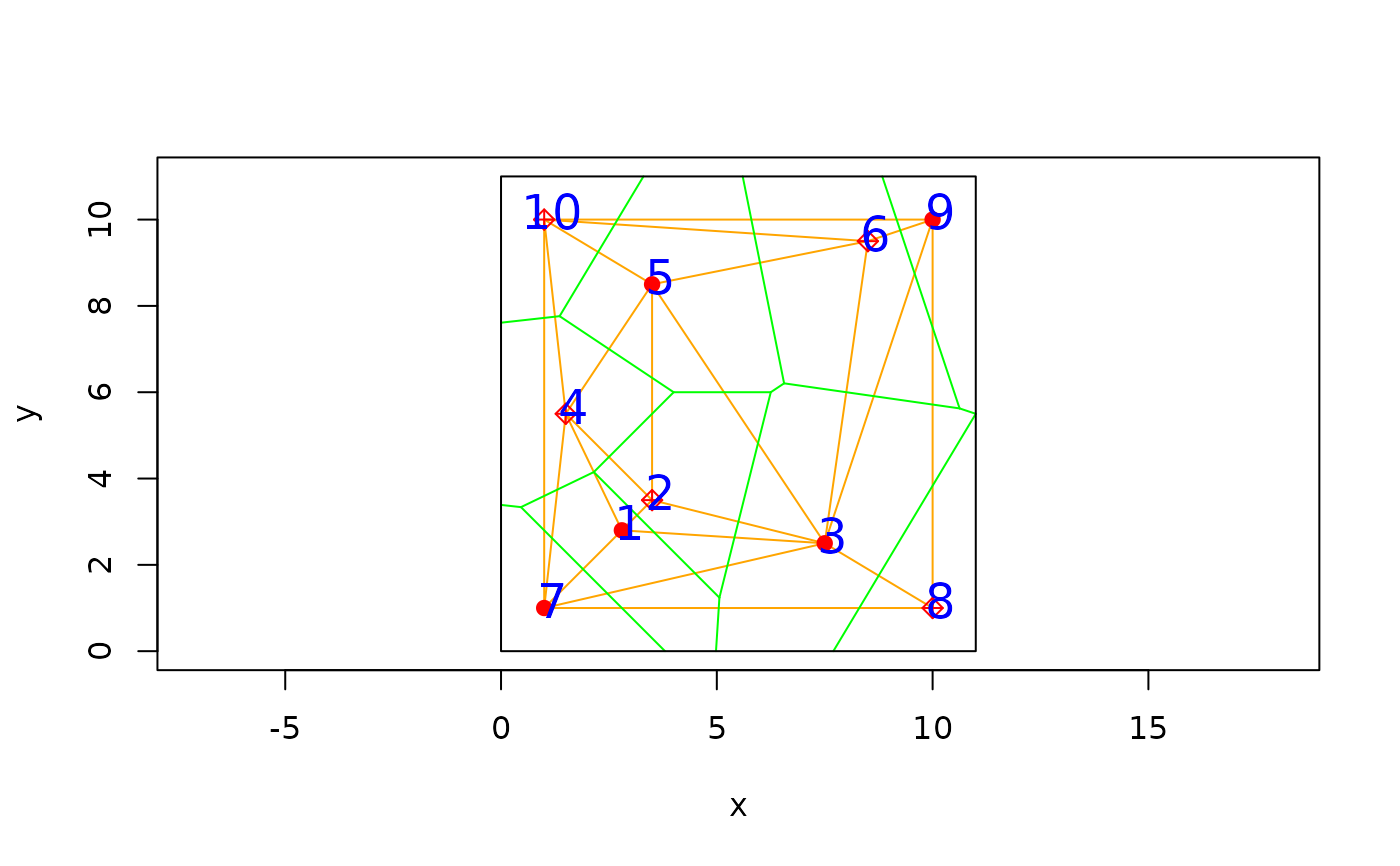
 # Plot everything:
plot(dxy,cmpnt_col=c("orange","green","red","blue","black"),cmpnt_lty=1,
labelPts=TRUE,lex=1.5,pch=c(19,9),showrect=TRUE,axes=TRUE)
# Plot everything:
plot(dxy,cmpnt_col=c("orange","green","red","blue","black"),cmpnt_lty=1,
labelPts=TRUE,lex=1.5,pch=c(19,9),showrect=TRUE,axes=TRUE)
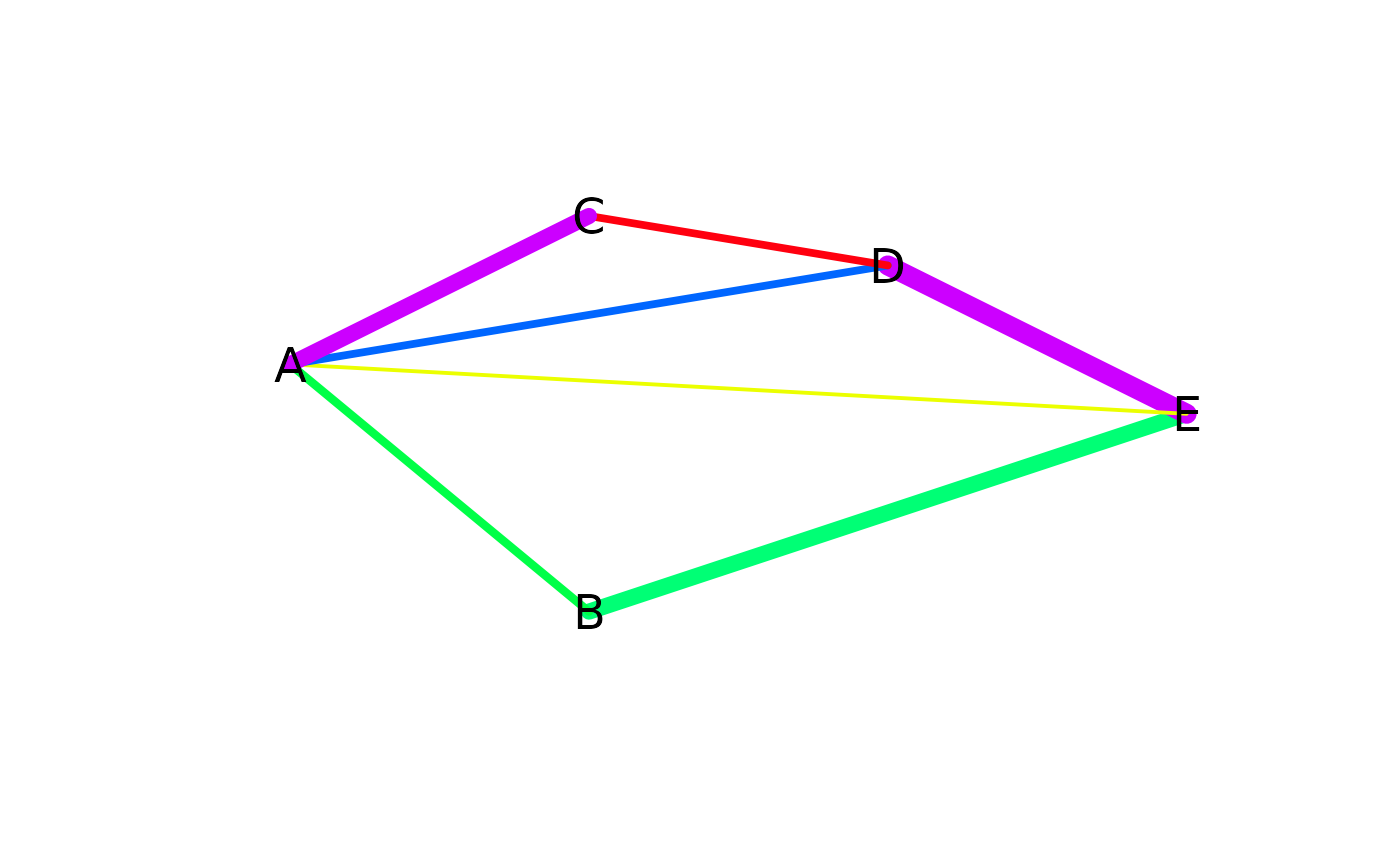
 # Complicated example from He Huang:
# "Linguistic distances".
vldm <- c(308.298557,592.555483,284.256926,141.421356,449.719913,
733.976839,591.141269,282.842712,1.414214,732.562625)
ldm <- matrix(nrow=5,ncol=5)
ldm[row(ldm) > col(ldm)] <- vldm
ldm[row(ldm) <= col(ldm)] <- 0
ldm <- (ldm + t(ldm))/2
rownames(ldm) <- LETTERS[1:5]
colnames(ldm) <- LETTERS[1:5]
# Data to be triangulated.
id <- c("A","B","C","D","E")
x <- c(0.5,1,1,1.5,2)
y <- c(5.5,3,7,6.5,5)
dat_Huang <- data.frame(id = id, x = x, y = y)
# Form the triangulation/tessellation.
dH <- deldir(dat_Huang)
# Plot the triangulation with line widths proportional
# to "linguistic distances".
all_col <- rainbow(100)
i <- pmax(1,round(100*vldm/max(vldm)))
use_col <- all_col[i]
ind <- as.matrix(dH$delsgs[,c("ind1","ind2")])
lwv <- ldm[ind]
lwv <- 10*lwv/max(lwv)
plot(dH,wlines="triang",col=use_col,showpoints=FALSE,
lw=lwv,asp=NA)
with(dH,text(x,y,id,cex=1.5))
# Complicated example from He Huang:
# "Linguistic distances".
vldm <- c(308.298557,592.555483,284.256926,141.421356,449.719913,
733.976839,591.141269,282.842712,1.414214,732.562625)
ldm <- matrix(nrow=5,ncol=5)
ldm[row(ldm) > col(ldm)] <- vldm
ldm[row(ldm) <= col(ldm)] <- 0
ldm <- (ldm + t(ldm))/2
rownames(ldm) <- LETTERS[1:5]
colnames(ldm) <- LETTERS[1:5]
# Data to be triangulated.
id <- c("A","B","C","D","E")
x <- c(0.5,1,1,1.5,2)
y <- c(5.5,3,7,6.5,5)
dat_Huang <- data.frame(id = id, x = x, y = y)
# Form the triangulation/tessellation.
dH <- deldir(dat_Huang)
# Plot the triangulation with line widths proportional
# to "linguistic distances".
all_col <- rainbow(100)
i <- pmax(1,round(100*vldm/max(vldm)))
use_col <- all_col[i]
ind <- as.matrix(dH$delsgs[,c("ind1","ind2")])
lwv <- ldm[ind]
lwv <- 10*lwv/max(lwv)
plot(dH,wlines="triang",col=use_col,showpoints=FALSE,
lw=lwv,asp=NA)
with(dH,text(x,y,id,cex=1.5))