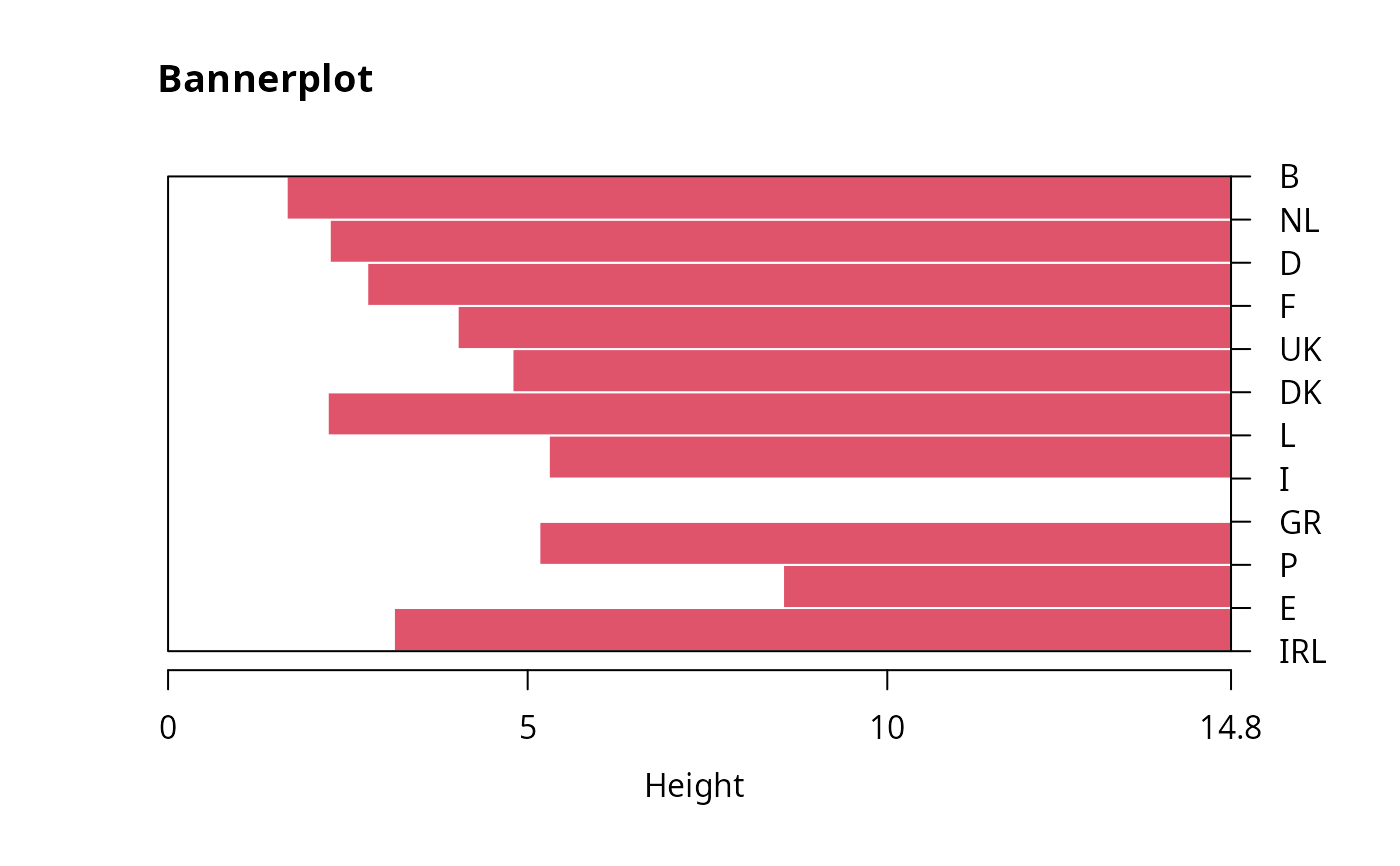
Plot Banner (of Hierarchical Clustering)
bannerplot.RdDraws a “banner”, i.e. basically a horizontal barplot
visualizing the (agglomerative or divisive) hierarchical clustering or
an other binary dendrogram structure.
Usage
bannerplot(x, w = rev(x$height), fromLeft = TRUE,
           main=NULL, sub=NULL, xlab = "Height",  adj = 0,
           col = c(2, 0), border = 0, axes = TRUE, frame.plot = axes,
           rev.xax = !fromLeft, xax.pretty = TRUE,
           labels = NULL, nmax.lab = 35, max.strlen = 5,
           yax.do = axes && length(x$order) <= nmax.lab,
           yaxRight = fromLeft, y.mar = 2.4 + max.strlen/2.5, ...)
Arguments
- x
a list with components
order,order.labandheightwhenw, the next argument is not specified.- w
non-negative numeric vector of bar widths.
- fromLeft
logical, indicating if the banner is from the left or not.
- main,sub
main and sub titles, see
title.- xlab
x axis label (with ‘correct’ default e.g. for
plot.agnes).- adj
passed to
title(main,sub)for string adjustment.- col
vector of length 2, for two horizontal segments.
- border
color for bar border; now defaults to background (no border).
- axes
logical indicating if axes (and labels) should be drawn at all.
- frame.plot
logical indicating the banner should be framed; mainly used when
border = 0(as per default).- rev.xax
logical indicating if the x axis should be reversed (as in
plot.diana).- xax.pretty
logical or integer indicating if
pretty()should be used for the x axis.xax.pretty = FALSEis mainly for back compatibility.- labels
labels to use on y-axis; the default is constructed from
x.- nmax.lab
integer indicating the number of labels which is considered too large for single-name labelling the banner plot.
- max.strlen
positive integer giving the length to which strings are truncated in banner plot labeling.
- yax.do
logical indicating if a y axis and banner labels should be drawn.
- yaxRight
logical indicating if the y axis is on the right or left.
- y.mar
positive number specifying the margin width to use when banners are labeled (along a y-axis). The default adapts to the string width and optimally would also dependend on the font.
- ...
graphical parameters (see
par) may also be supplied as arguments to this function.
Note
This is mainly a utility called from plot.agnes,
plot.diana and plot.mona.