Self-Organizing Maps: Batch Algorithm
batchSOM.RdKohonen's Self-Organizing Maps are a crude form of multidimensional scaling.
batchSOM(data, grid = somgrid(), radii, init)Arguments
- data
a matrix or data frame of observations, scaled so that Euclidean distance is appropriate.
- grid
A grid for the representatives: see
somgrid.- radii
the radii of the neighbourhood to be used for each pass: one pass is run for each element of
radii.- init
the initial representatives. If missing, chosen (without replacement) randomly from
data.
Value
An object of class "SOM" with components
- grid
the grid, an object of class
"somgrid".- codes
a matrix of representatives.
Details
The batch SOM algorithm of Kohonen(1995, section 3.14) is used.
References
Kohonen, T. (1995) Self-Organizing Maps. Springer-Verlag.
Ripley, B. D. (1996) Pattern Recognition and Neural Networks. Cambridge.
Venables, W. N. and Ripley, B. D. (2002) Modern Applied Statistics with S. Fourth edition. Springer.
Examples
require(graphics)
data(crabs, package = "MASS")
lcrabs <- log(crabs[, 4:8])
crabs.grp <- factor(c("B", "b", "O", "o")[rep(1:4, rep(50,4))])
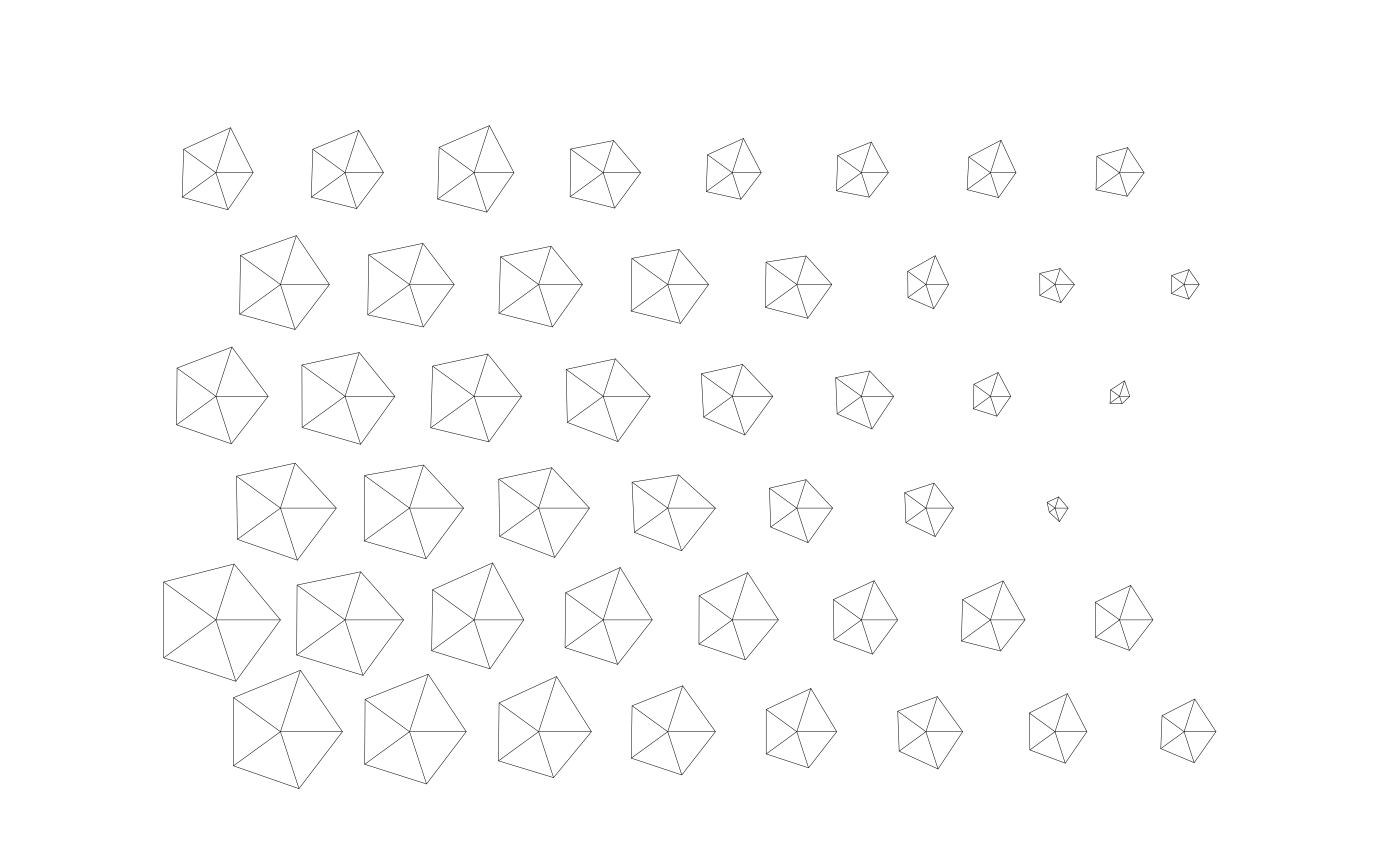
gr <- somgrid(topo = "hexagonal")
crabs.som <- batchSOM(lcrabs, gr, c(4, 4, 2, 2, 1, 1, 1, 0, 0))
plot(crabs.som)

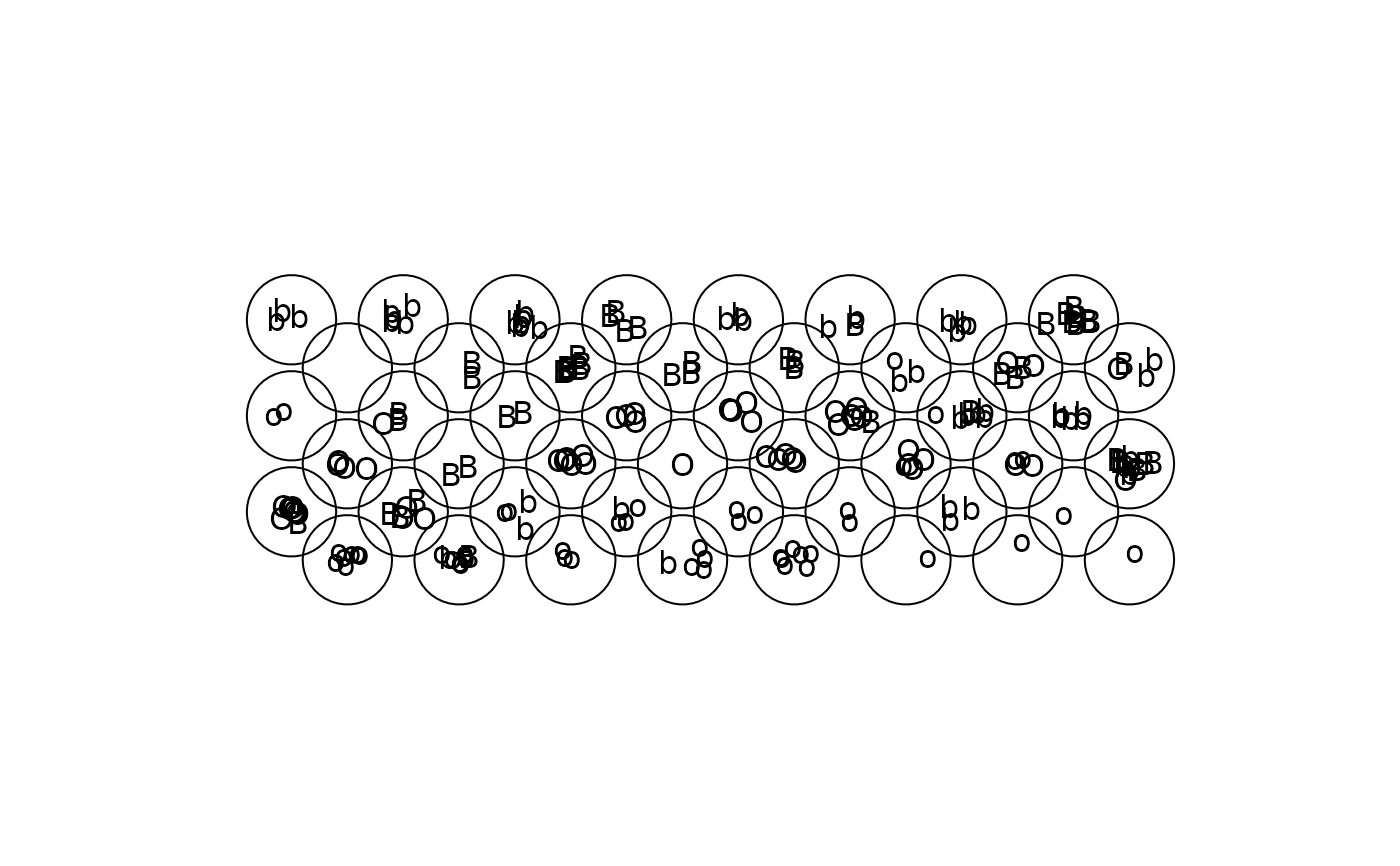
 bins <- as.numeric(knn1(crabs.som$codes, lcrabs, 0:47))
plot(crabs.som$grid, type = "n")
symbols(crabs.som$grid$pts[, 1], crabs.som$grid$pts[, 2],
circles = rep(0.4, 48), inches = FALSE, add = TRUE)
text(crabs.som$grid$pts[bins, ] + rnorm(400, 0, 0.1),
as.character(crabs.grp))
bins <- as.numeric(knn1(crabs.som$codes, lcrabs, 0:47))
plot(crabs.som$grid, type = "n")
symbols(crabs.som$grid$pts[, 1], crabs.som$grid$pts[, 2],
circles = rep(0.4, 48), inches = FALSE, add = TRUE)
text(crabs.som$grid$pts[bins, ] + rnorm(400, 0, 0.1),
as.character(crabs.grp))