Label placement for points to avoid overlaps
pointLabel.RdUse optimization routines to find good locations for point labels without overlaps.
Arguments
- x, y
as with
plot.default, these provide the x and y coordinates for the point labels. Any reasonable way of defining the coordinates is acceptable. See the functionxy.coordsfor details.- labels
as with
text, a character vector or expression specifying the text to be written. An attempt is made to coerce other language objects (names and calls) to expressions, and vectors and other classed objects to character vectors byas.character.- cex
numeric character expansion factor as with
text.- method
the optimization method, either “SANN” for simulated annealing (the default) or “GA” for a genetic algorithm.
- allowSmallOverlap
logical; if
TRUE, labels are allowed a small overlap. The overlap allowed is 2% of the diagonal distance of the plot area.- trace
logical; if
TRUE, status updates are given as the optimization algorithms progress.- doPlot
logical; if
TRUE, the labels are plotted on the existing graph withtext.- ...
arguments passed along to
textto specify labeling parameters such ascol.
Details
Eight positions are candidates for label placement, either horizontally, vertically, or diagonally offset from the points. The default position for labels is the top right diagonal relative to the point (considered the preferred label position).
With the default settings, simulating annealing solves faster than the genetic algorithm. It is an open question as to which settles into a global optimum the best (both algorithms have parameters that may be tweaked).
The label positioning problem is NP-hard (nondeterministic polynomial-time hard). Placement becomes difficult and slows considerably with large numbers of points. This function places all labels, whether overlaps occur or not. Some placement algorithms remove labels that overlap.
Note that only cex is used to calculate string width and
height (using strwidth and strheight), so passing a
different font may corrupt the label dimensions. You could get around
this by adjusting the font parameters with par prior to running
this function.
Note
This function was moved from the maptools package in anticipation of the retirement of that package, and with the permission of the function author.
References
https://en.wikipedia.org/wiki/Automatic_label_placement
Old URL: https://i11www.iti.uni-karlsruhe.de/map-labeling/bibliography/
http://www.eecs.harvard.edu/~shieber/Projects/Carto/carto.html
The genetic algorithm code was adapted from the python code at
https://meta.wikimedia.org/wiki/Map_generator.
The simulated annealing code follows the algorithm and guidelines in:
Jon Christensen, Joe Marks, and Stuart Shieber. Placing text labels on maps and diagrams. In Paul Heckbert, editor, Graphics Gems IV, pages 497-504. Academic Press, Boston, MA, 1994. http://www.eecs.harvard.edu/~shieber/Biblio/Papers/jc.label.pdf
Author
Tom Short, EPRI, tshort@epri.com
See also
text, thigmophobe.labels
in package plotrix
Examples
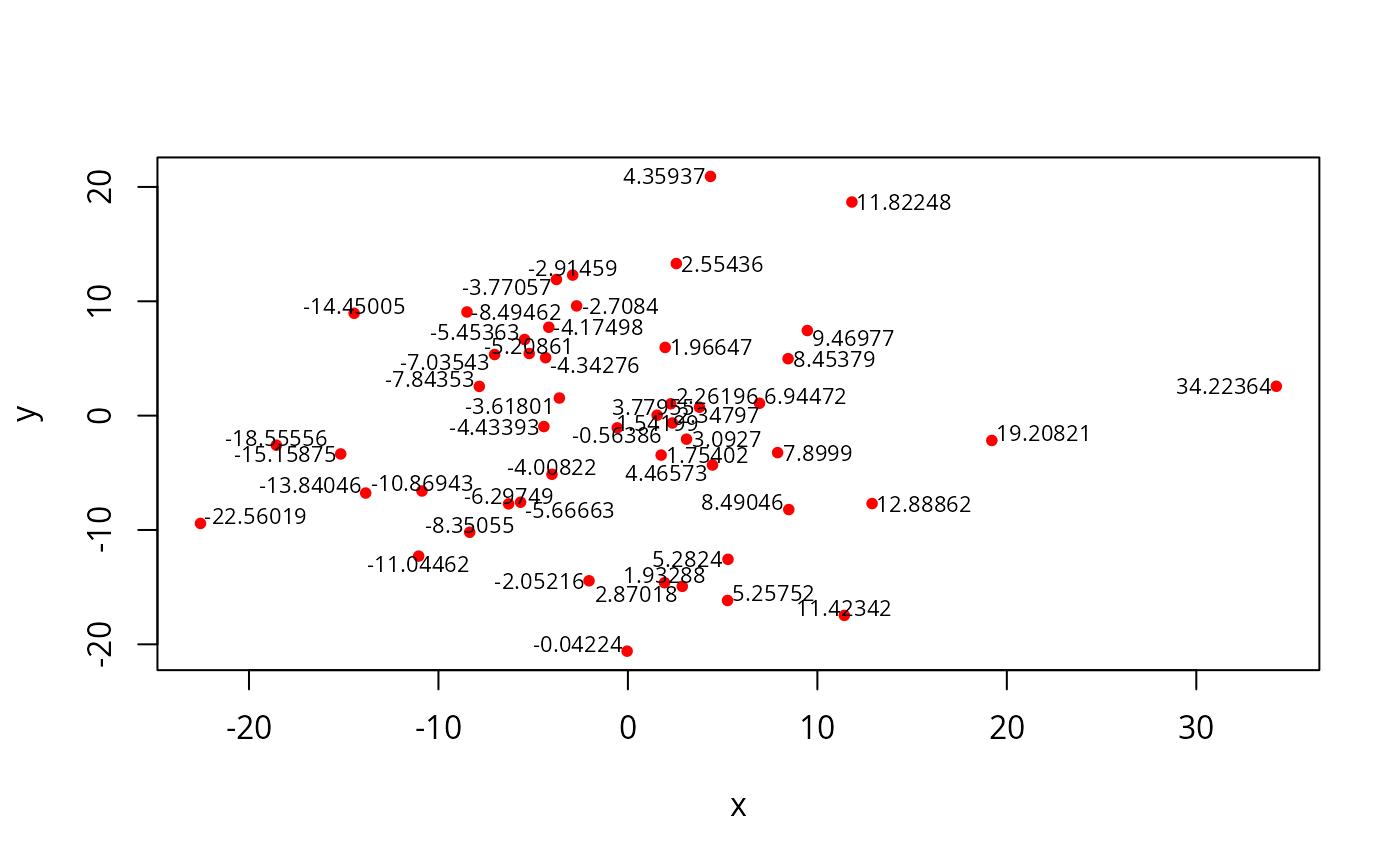
n <- 50
x <- rnorm(n)*10
y <- rnorm(n)*10
plot(x, y, col = "red", pch = 20)
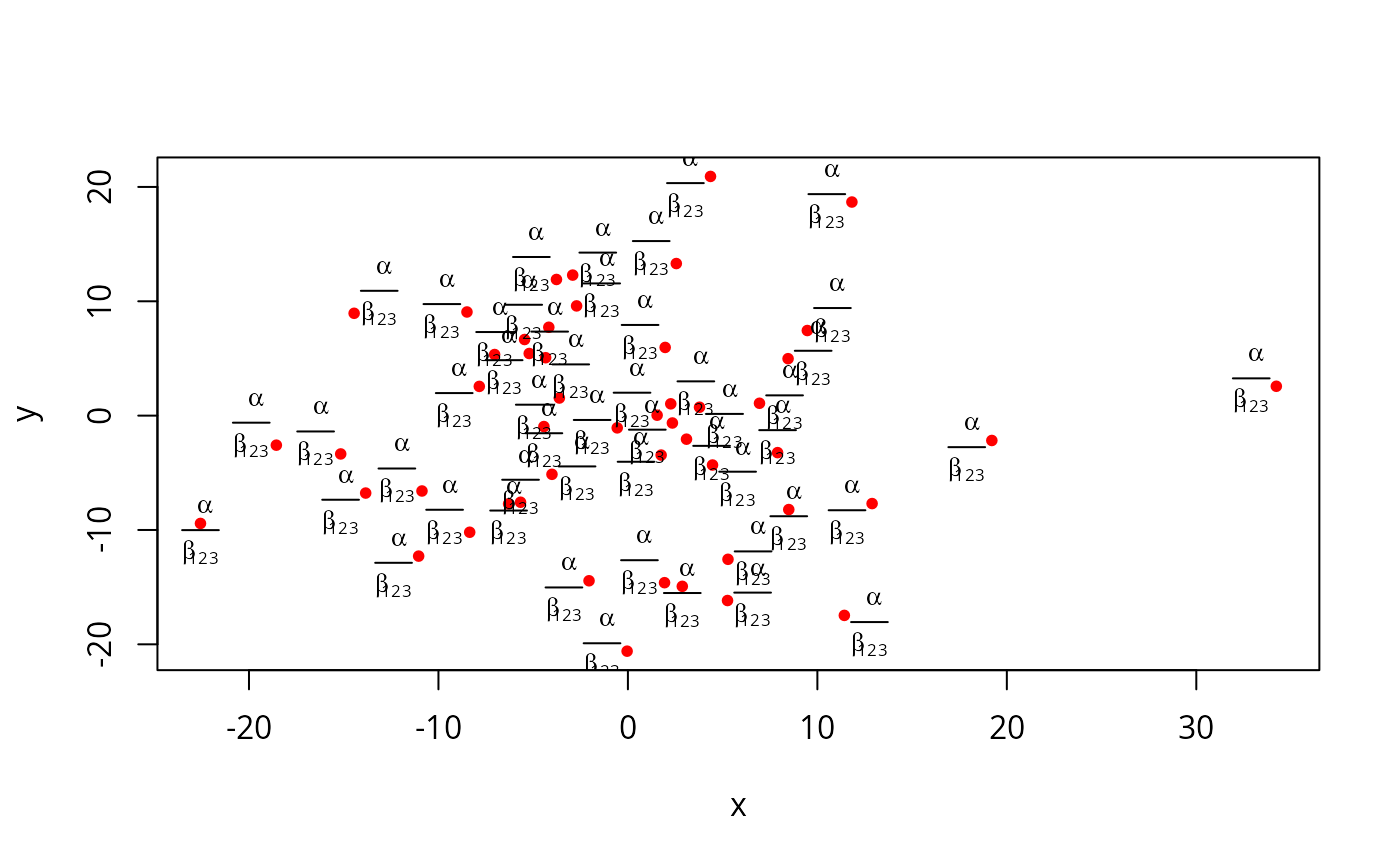
pointLabel(x, y, as.character(round(x,5)), offset = 0, cex = .7)
 plot(x, y, col = "red", pch = 20)
pointLabel(x, y, expression(over(alpha, beta[123])), offset = 0, cex = .8)
plot(x, y, col = "red", pch = 20)
pointLabel(x, y, expression(over(alpha, beta[123])), offset = 0, cex = .8)