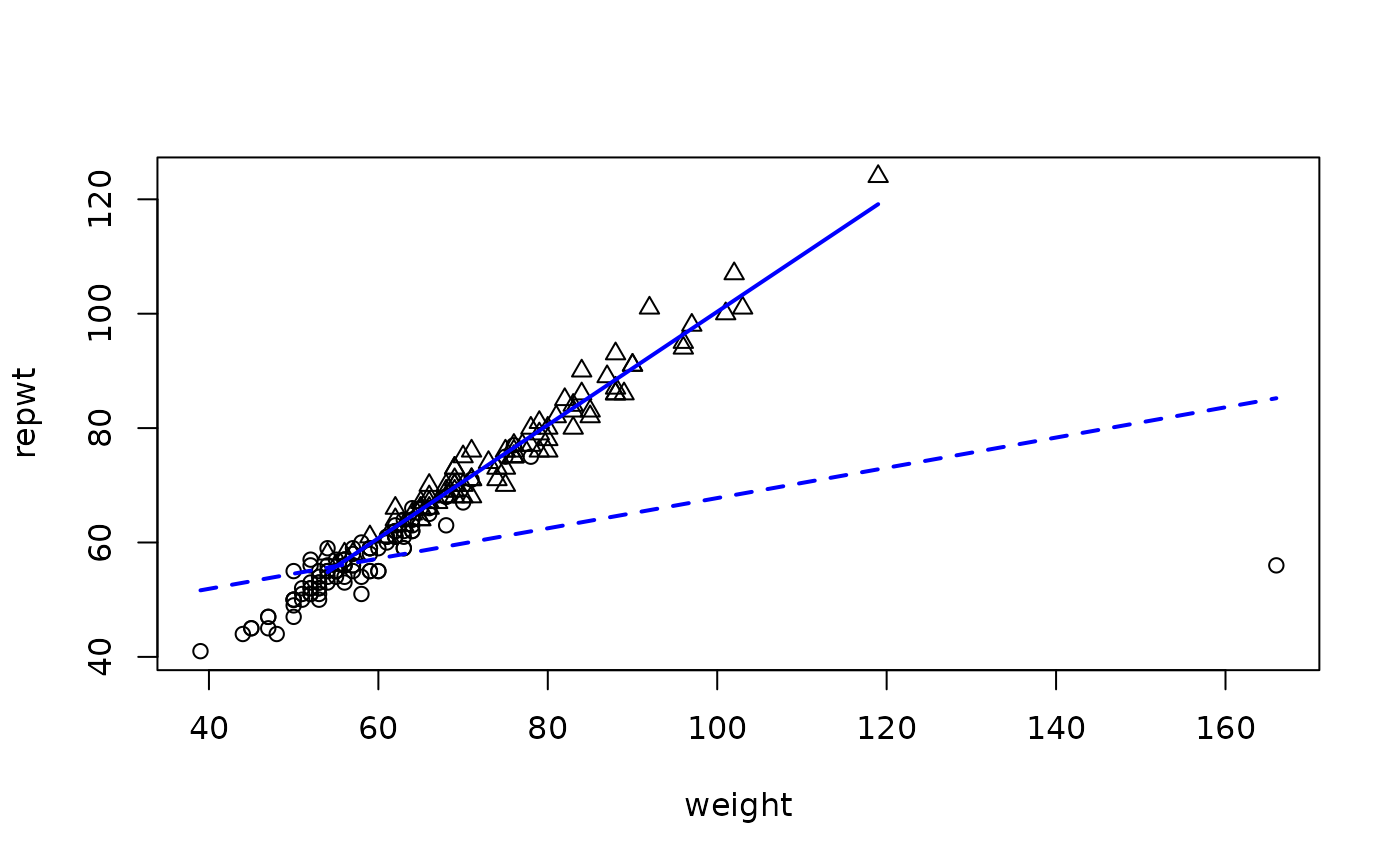
Plot Regression Line
regLine.RdPlots a regression line on a scatterplot; the line is plotted between the minimum and maximum x-values.
regLine(mod, col=carPalette()[2], lwd=2, lty=1,...)Arguments
- mod
a model, such as produced by
lm, that responds to thecoeffunction by returning a 2-element vector, whose elements are interpreted respectively as the intercept and slope of a regresison line.- col
color for points and lines; the default is the second entry in the current car palette (see
carPaletteandpar).- lwd
line width; default is
2(seepar).- lty
line type; default is
1, a solid line (seepar).- ...
optional arguments to be passed to the
linesplotting function.
Details
In contrast to abline, this function plots only over
the range of the observed x-values. The x-values are extracted from
mod as the second column of the model matrix.
Value
NULL. This function is used for its side effect: adding
a line to the plot.