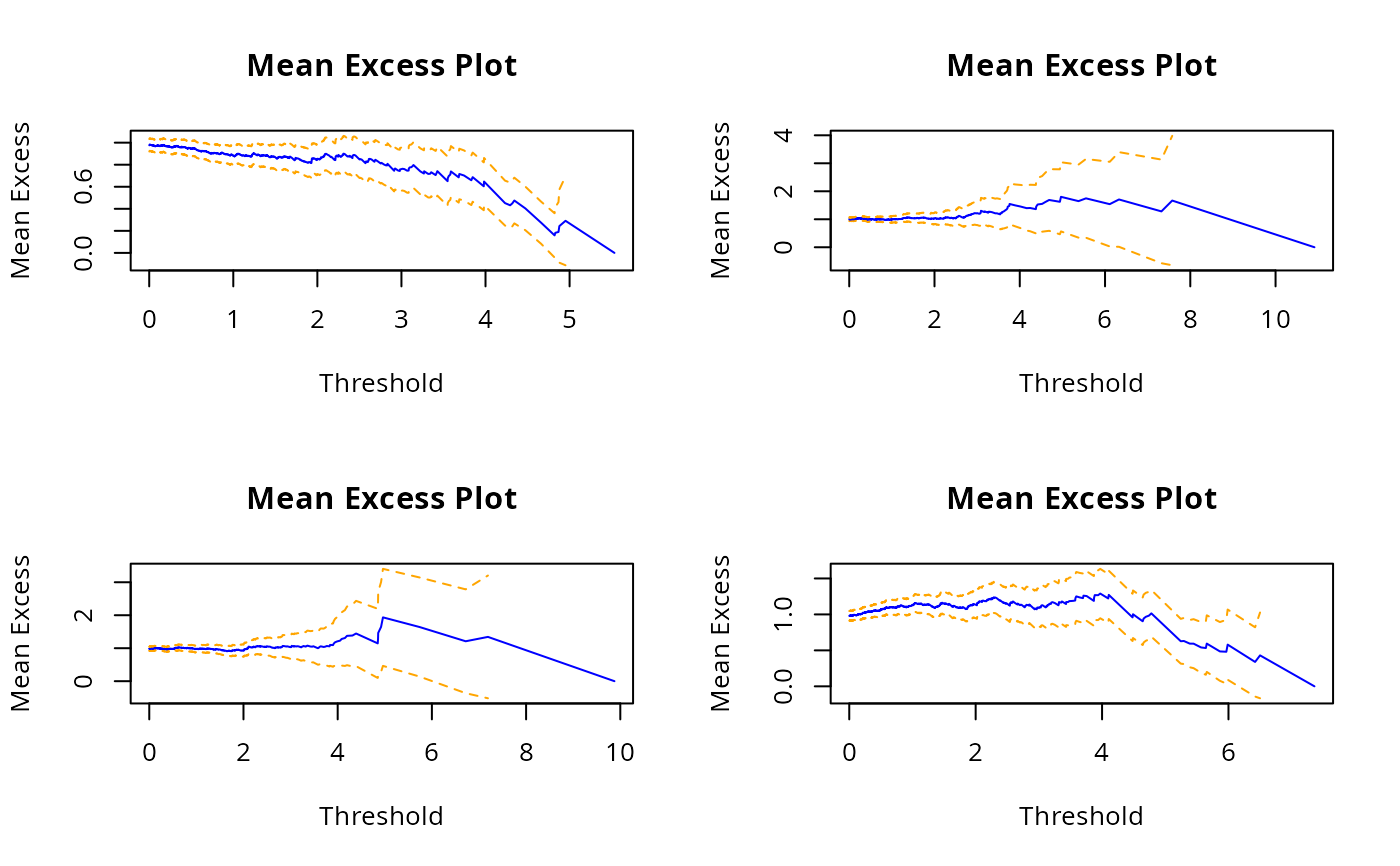
Mean Excess Plot
meplot.RdMean excess plot (also known as a mean residual life plot), a diagnostic plot for the generalized Pareto distribution (GPD).
Arguments
- y
A numerical vector.
NAs etc. are not allowed.- main, xlab, ylab
Character. Overall title for the plot, and titles for the x- and y-axes.
- lty
Line type. The second value is for the mean excess value, the first and third values are for the envelope surrounding the confidence interval.
- conf
Confidence level. The default results in approximate 95 percent confidence intervals for each mean excess value.
- col
Colour of the three lines.
- type
Type of plot. The default means lines are joined between the mean excesses and also the upper and lower limits of the confidence intervals.
- object
An object that inherits class
"vlm", usually of classvglm-classorvgam-class.- ...
Graphical argument passed into
plot. Seeparfor an exhaustive list. The argumentsxlimandylimare particularly useful.
Details
If \(Y\) has a GPD with scale parameter
\(\sigma\) and shape parameter \(\xi<1\),
and if \(y>0\), then
$$E(Y-u|Y>u) = \frac{\sigma+\xi u}{1-\xi}.$$
It is a linear function in \(u\), the threshold.
Note that \(Y-u\) is called the excess and
values of \(Y\) greater than \(u\) are
called exceedances.
The empirical versions used by these functions is to use
sample means to estimate the left hand side of the equation.
Values of \(u\) in the plot are the values of \(y\) itself.
If the plot is roughly a straight line then the GPD is a good
fit; this plot can be used to select an appropriate threshold
value. See gpd for more details.
If the plot is flat then the data may be exponential,
and if it is curved then it may be Weibull or gamma.
There is often a lot of variance/fluctuation at the RHS of the
plot due to fewer observations.
The function meplot is generic, and
meplot.default and meplot.vlm are some
methods functions for mean excess plots.
Value
A list is returned invisibly with the following components.
- threshold
The x axis values.
- meanExcess
The y axis values. Each value is a sample mean minus a value \(u\).
- plusminus
The amount which is added or subtracted from the mean excess to give the confidence interval. The last value is a
NAbecause it is based on one observation.
References
Davison, A. C. and Smith, R. L. (1990). Models for exceedances over high thresholds (with discussion). Journal of the Royal Statistical Society, Series B, Methodological, 52, 393–442.
Coles, S. (2001). An Introduction to Statistical Modeling of Extreme Values. London: Springer-Verlag.
Note
The function is designed for speed and not accuracy, therefore
huge data sets with extremely large values may cause failure
(the function cumsum is used.) Ties may
not be well handled.
See also
gpd.