Chernoff Faces
faces.Rdfaces represent the rows of a data matrix by faces
faces(xy, which.row, fill = FALSE, nrow, ncol, scale = TRUE, byrow = FALSE, main, labels)Arguments
- xy
xydata matrix, rows represent individuals and columns attributes- which.row
defines a permutation of the rows of the input matrix
- fill
if(fill==TRUE), only the firstncattributes of the faces are transformed,ncis the number of columns ofxy- nrow
number of columns of faces on graphics device
- ncol
number of rows of faces
- scale
if(scale==TRUE), attributes will be normalized- byrow
if(byrow==TRUE),xywill be transposed- main
title
- labels
character strings to use as names for the faces
Details
The features paramters of this implementation are:
1-height of face,
2-width of face,
3-shape of face,
4-height of mouth,
5-width of mouth,
6-curve of smile,
7-height of eyes,
8-width of eyes,
9-height of hair,
10-width of hair,
11-styling of hair,
12-height of nose,
13-width of nose,
14-width of ears,
15-height of ears. For details look at the literate program of faces
Value
a plot of faces is created on the graphics device, no numerical results
References
Chernoff, H. (1973): The use of faces to represent statistiscal assoziation, JASA, 68, pp 361–368. The smooth curves are computed by an algorithm found in Ralston, A. and Rabinowitz, P. (1985): A first course in numerical analysis, McGraw-Hill, pp 76ff. http://www.uni-bielefeld.de/fakultaeten/wirtschaftswissenschaften : S/R - functions : faces
Note
version 12/2003
See also
—
Examples
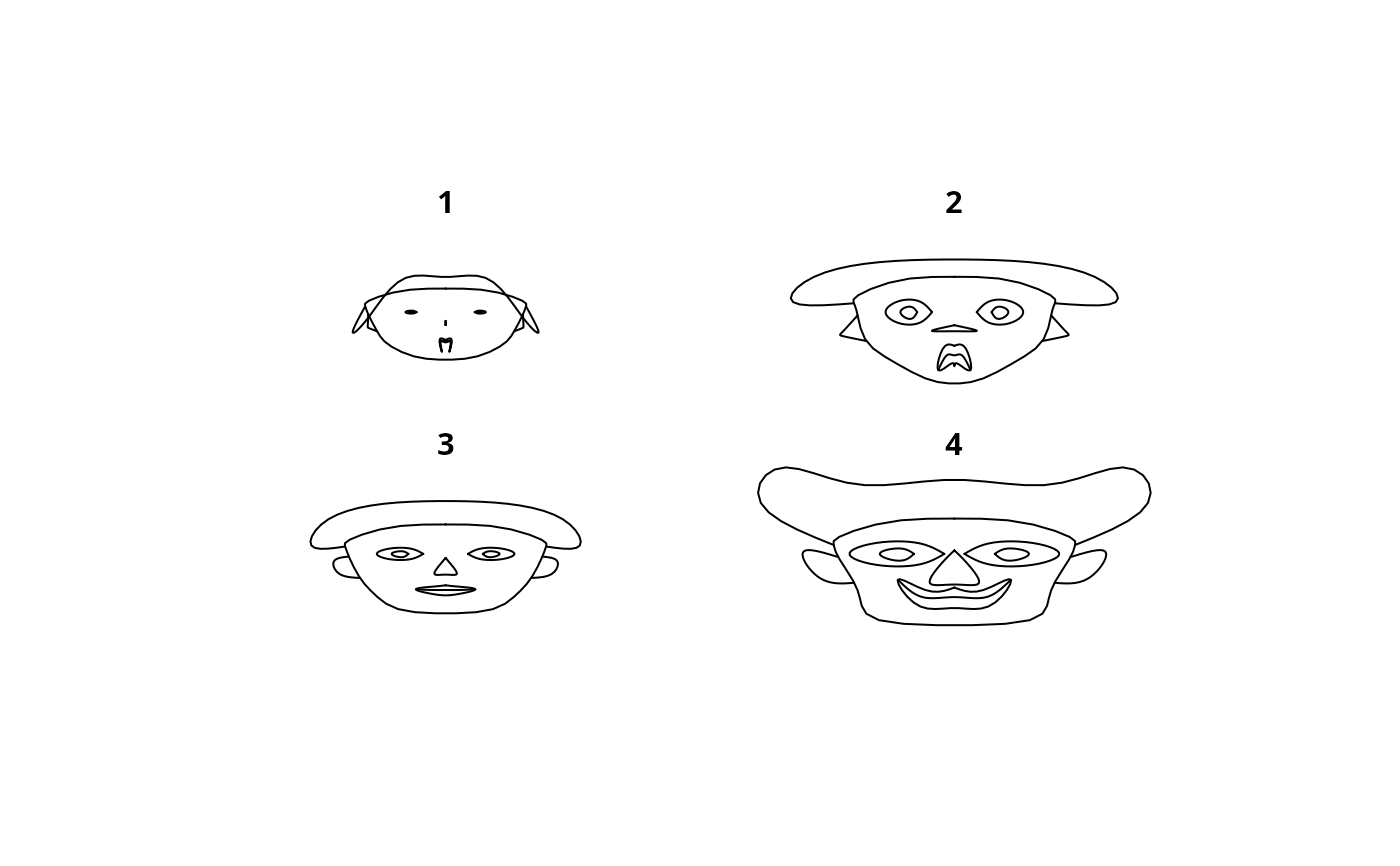
faces(rbind(1:3,5:3,3:5,5:7))
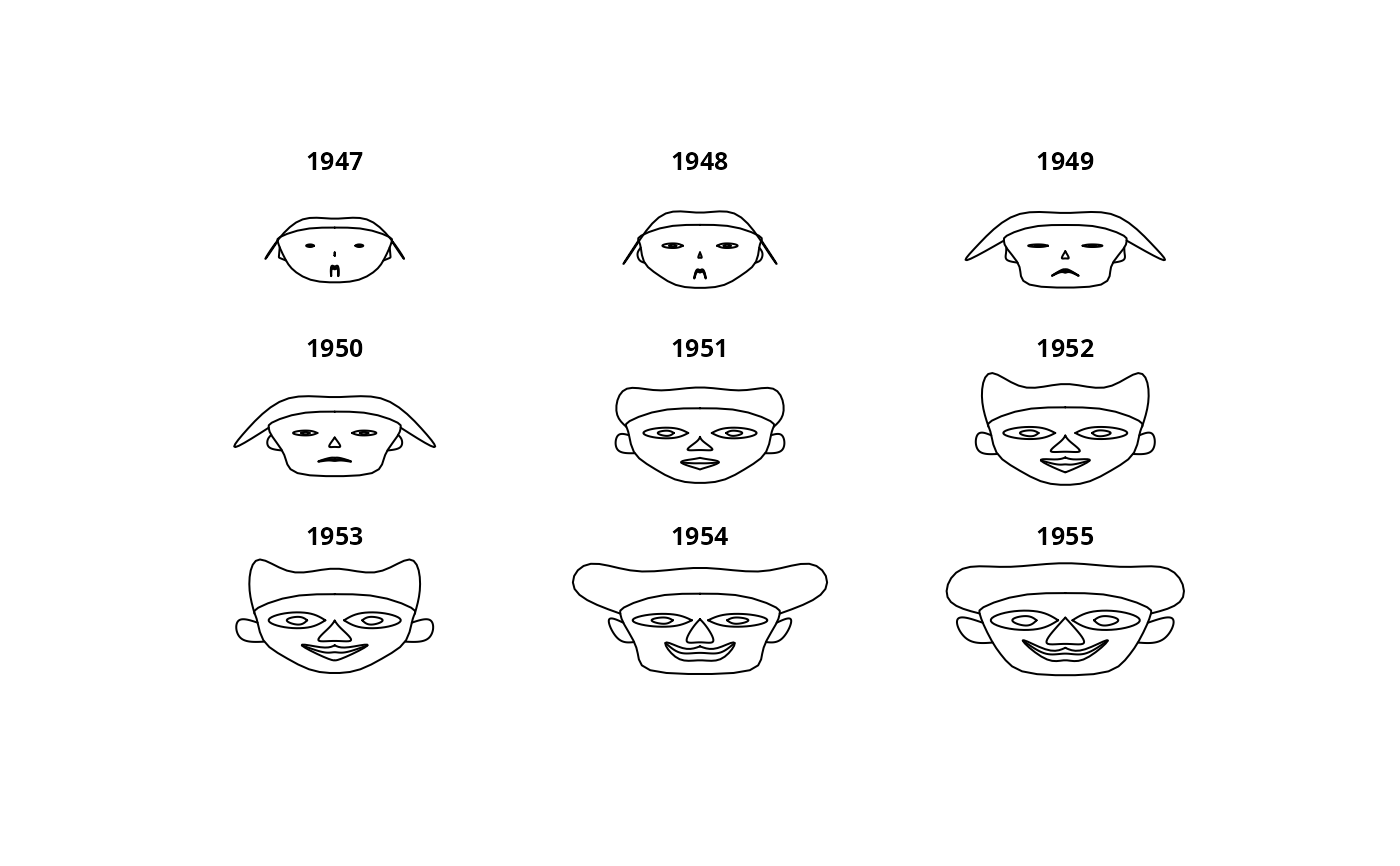
 data(longley)
faces(longley[1:9,])
data(longley)
faces(longley[1:9,])
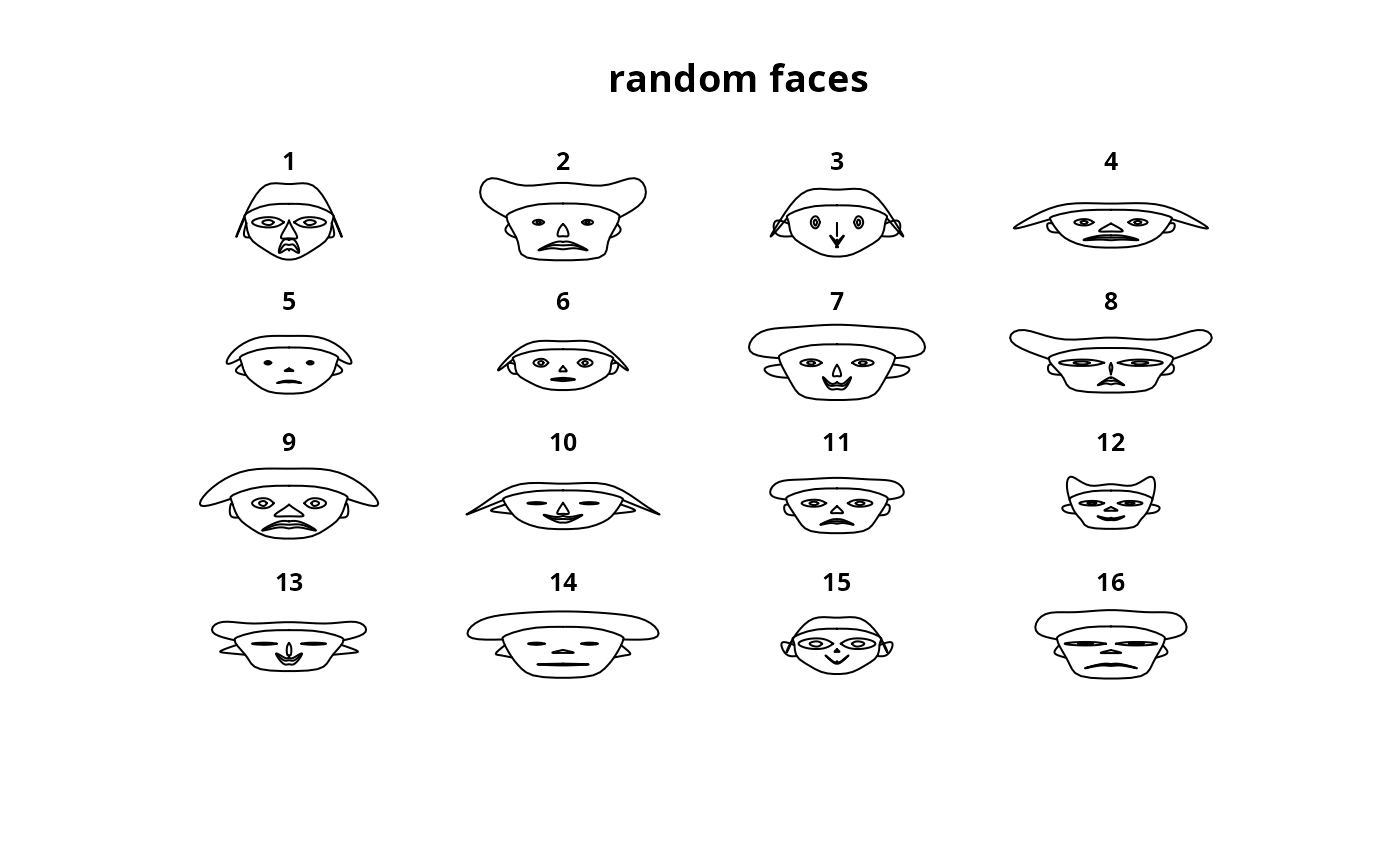
 set.seed(17)
faces(matrix(sample(1:1000,128,),16,8),main="random faces")
set.seed(17)
faces(matrix(sample(1:1000,128,),16,8),main="random faces")
 if(interactive()){
tke1 <- rep( list(list('slider',from=0,to=1,init=0.5,resolution=0.1)), 15)
names(tke1) <- c('FaceHeight','FaceWidth','FaceShape','MouthHeight',
'MouthWidth','SmileCurve','EyesHeight','EyesWidth','HairHeight',
'HairWidth','HairStyle','NoseHeight','NoseWidth','EarWidth','EarHeight')
tkfun1 <- function(...){
tmpmat <- rbind(Min=0,Adjust=unlist(list(...)),Max=1)
faces(tmpmat, scale=FALSE)
}
tkexamp( tkfun1, list(tke1), plotloc='left', hscale=2, vscale=2 )
}
if(interactive()){
tke1 <- rep( list(list('slider',from=0,to=1,init=0.5,resolution=0.1)), 15)
names(tke1) <- c('FaceHeight','FaceWidth','FaceShape','MouthHeight',
'MouthWidth','SmileCurve','EyesHeight','EyesWidth','HairHeight',
'HairWidth','HairStyle','NoseHeight','NoseWidth','EarWidth','EarHeight')
tkfun1 <- function(...){
tmpmat <- rbind(Min=0,Adjust=unlist(list(...)),Max=1)
faces(tmpmat, scale=FALSE)
}
tkexamp( tkfun1, list(tke1), plotloc='left', hscale=2, vscale=2 )
}