Create a quick dotchart (histogram)
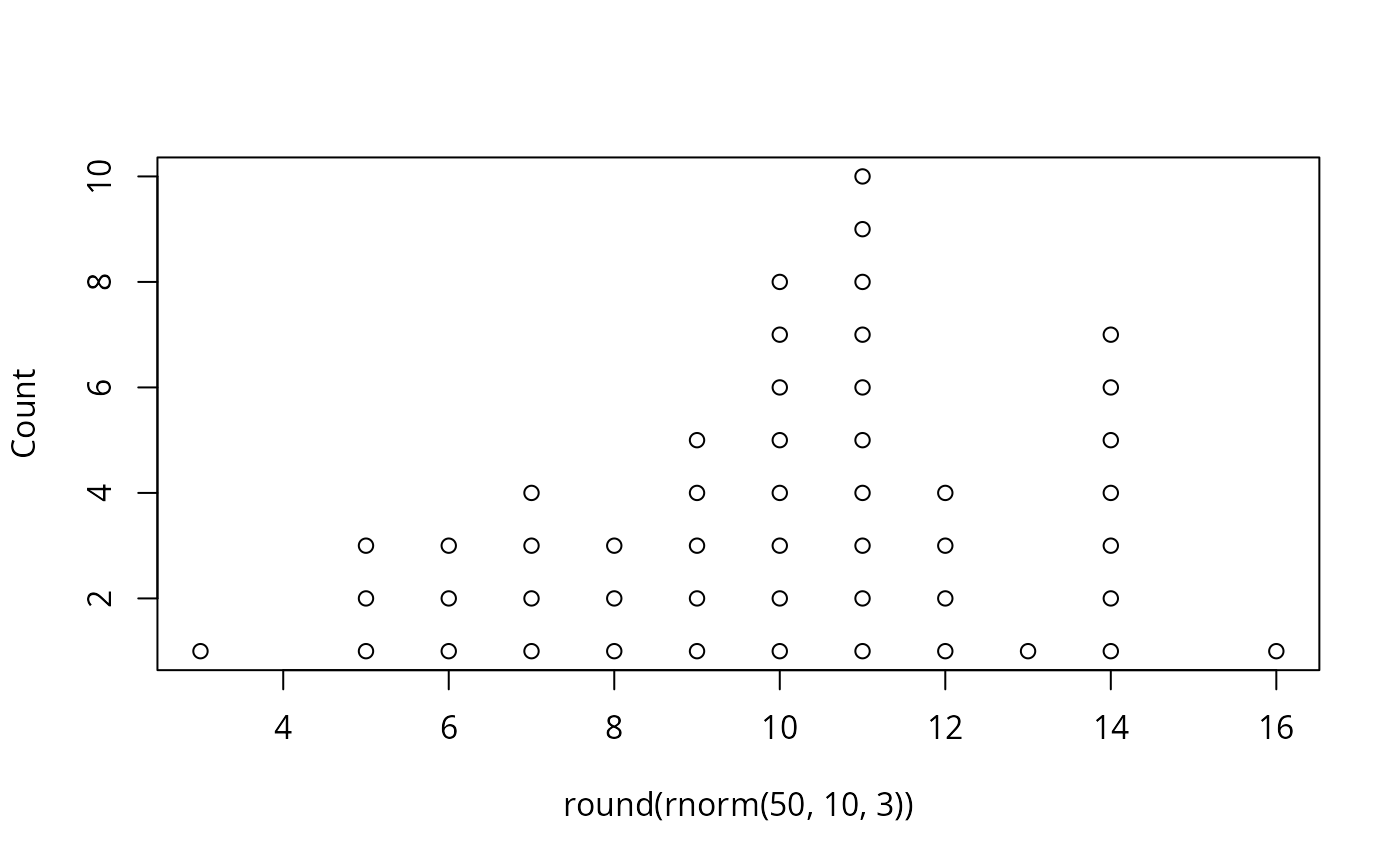
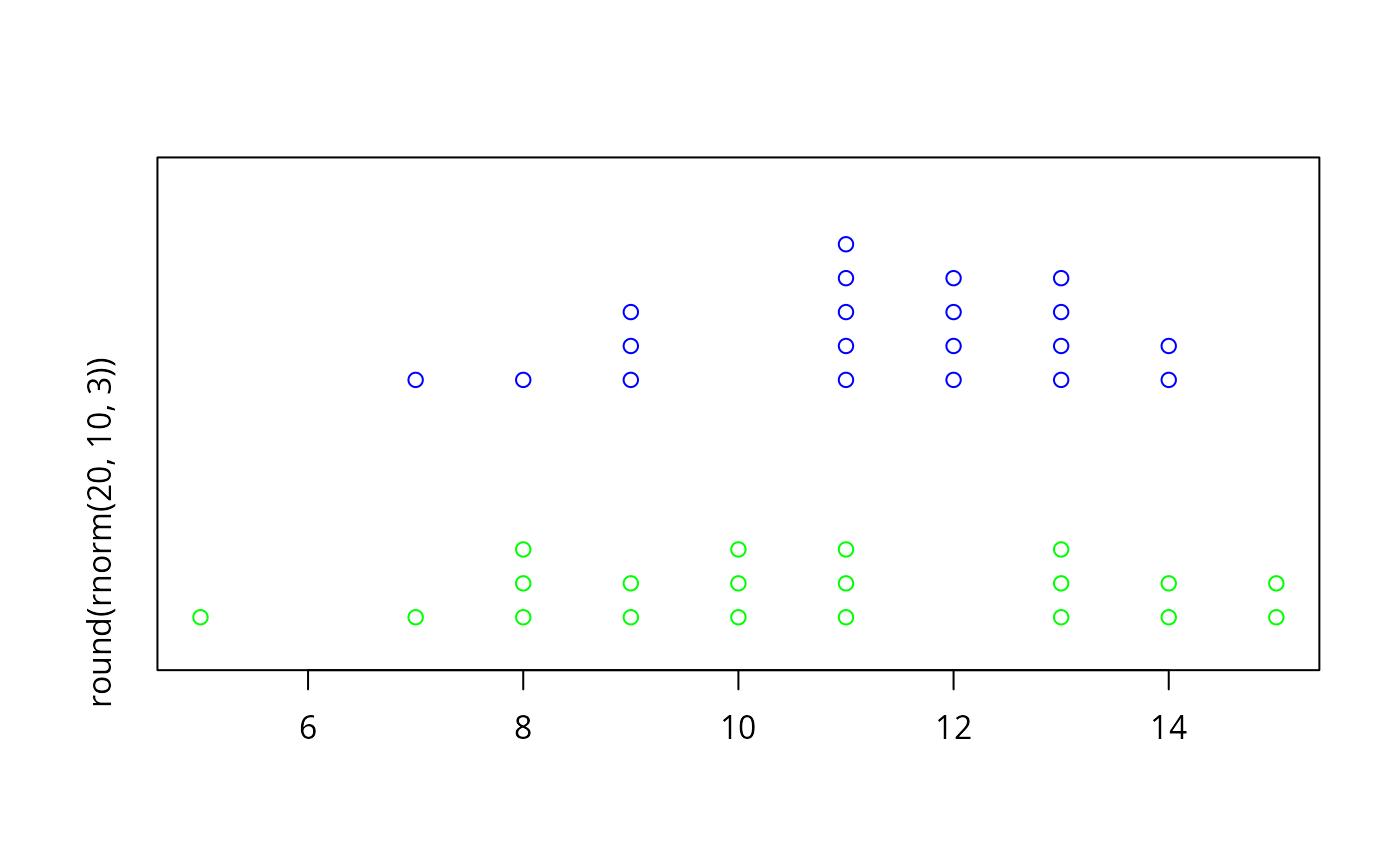
dots.RdCreate a quick dotchart of 1 or 2 datasets. These dotcharts are a poor man's histogram, not the trellis dotplot.
dots(x,...)
dots2(x, y, colx = "green", coly = "blue", lab1 =
deparse(substitute(x)), lab2 = deparse(substitute(y)),...)
Arguments
Details
These functions create basic dotcharts that are quick "back of the envelope" approximations to histograms. Mainly intended for demonstration.
Value
No meaninful value. These functions are run for the side effect of creating a plot.