Simulate rolling dice
dice.RdSimulate and optionally plot rolls of dice.
Arguments
- rolls
Scalar, the number of times to roll the dice.
- ndice
Scalar, the number of dice to roll each time.
- sides
Scalar, the number of sides per die.
- plot.it
Logical, Should the results be plotted.
- load
Vector of length
sides, how the dice should be loaded.- x
Data frame, return value from
dice.- ...
Additional arguments passed to lattice plotting function.
Details
Simulates the rolling of dice. By default it will roll 2 dice 1 time
and the dice will be fair. Internally the sample function is
used and the load option is passed to sample. load is not
required to sum to 1, but the elements will be divided by the sum of
all the values.
Value
A data frame with rolls rows and ndice columns
representing the results from rolling the dice.
If only 1 die is rolled, then the return value will be a vector.
If plot.it is TRUE, then the return value will be invisible.
Note
If the plot function is used or if plot.it is TRUE, then a
plot will be created on the current graphics device.
See also
Examples
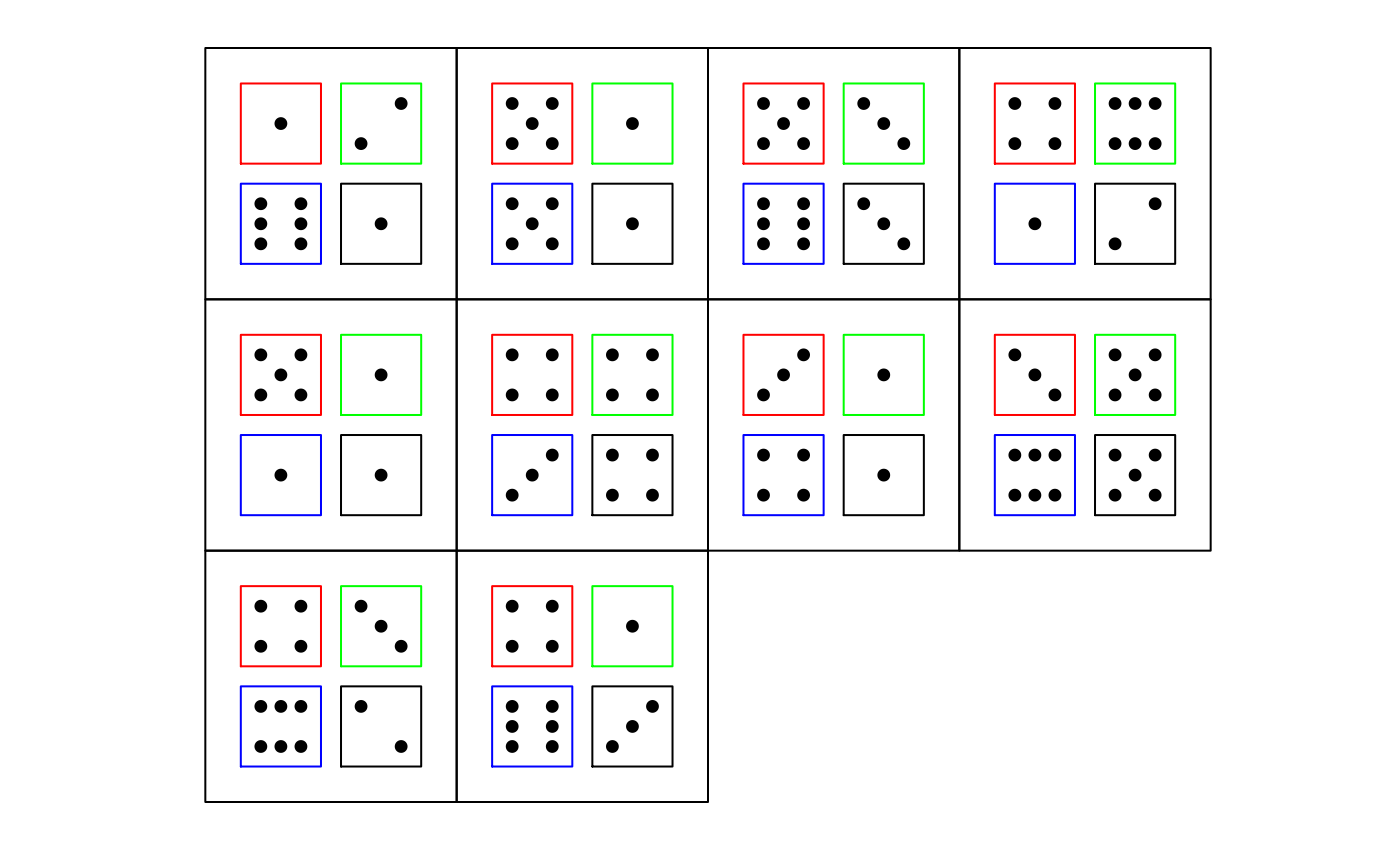
# 10 rolls of 4 fair dice
dice(10,4, plot.it=TRUE)
 # or
plot(dice(10,4))
# or
plot(dice(10,4))
 # or
tmp <- dice(10,4)
plot(tmp)
# or
tmp <- dice(10,4)
plot(tmp)
 # a loaded die
table(tmp <- dice(100,1,plot.it=TRUE, load=6:1 ) )
# a loaded die
table(tmp <- dice(100,1,plot.it=TRUE, load=6:1 ) )
 #> Red
#> 1 2 3 4 5 6
#> 27 28 22 10 8 5
colMeans(tmp)
#> Red
#> 2.59
# Efron's dice
ed <- list( rep( c(4,0), c(4,2) ),
rep(3,6), rep( c(6,2), c(2,4) ),
rep( c(5,1), c(3,3) ) )
tmp <- dice( 10000, ndice=4 )
ed.out <- sapply(1:4, function(i) ed[[i]][ tmp[[i]] ] )
mean(ed.out[,1] > ed.out[,2])
#> [1] 0.664
mean(ed.out[,2] > ed.out[,3])
#> [1] 0.6652
mean(ed.out[,3] > ed.out[,4])
#> [1] 0.6666
mean(ed.out[,4] > ed.out[,1])
#> [1] 0.6742
## redo De Mere's question
demere1 <- dice(10000,4)
demere2 <- dice(10000,24,sides=36)
mean(apply( demere1, 1, function(x) 6 %in% x ))
#> [1] 0.5122
mean(apply( demere2, 1, function(x) 36 %in% x))
#> [1] 0.4959
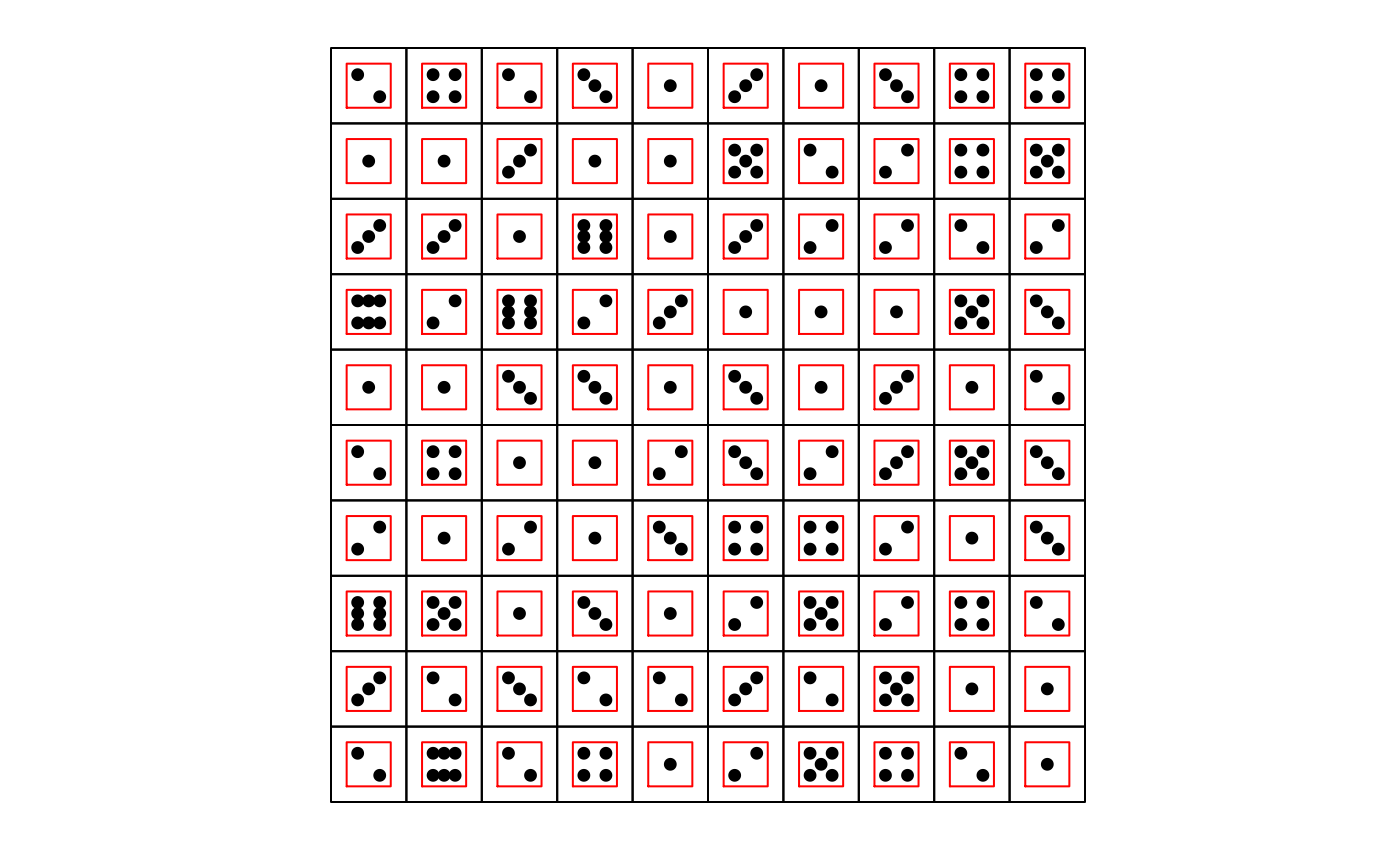
plot(demere1[1:10,])
#> Red
#> 1 2 3 4 5 6
#> 27 28 22 10 8 5
colMeans(tmp)
#> Red
#> 2.59
# Efron's dice
ed <- list( rep( c(4,0), c(4,2) ),
rep(3,6), rep( c(6,2), c(2,4) ),
rep( c(5,1), c(3,3) ) )
tmp <- dice( 10000, ndice=4 )
ed.out <- sapply(1:4, function(i) ed[[i]][ tmp[[i]] ] )
mean(ed.out[,1] > ed.out[,2])
#> [1] 0.664
mean(ed.out[,2] > ed.out[,3])
#> [1] 0.6652
mean(ed.out[,3] > ed.out[,4])
#> [1] 0.6666
mean(ed.out[,4] > ed.out[,1])
#> [1] 0.6742
## redo De Mere's question
demere1 <- dice(10000,4)
demere2 <- dice(10000,24,sides=36)
mean(apply( demere1, 1, function(x) 6 %in% x ))
#> [1] 0.5122
mean(apply( demere2, 1, function(x) 36 %in% x))
#> [1] 0.4959
plot(demere1[1:10,])
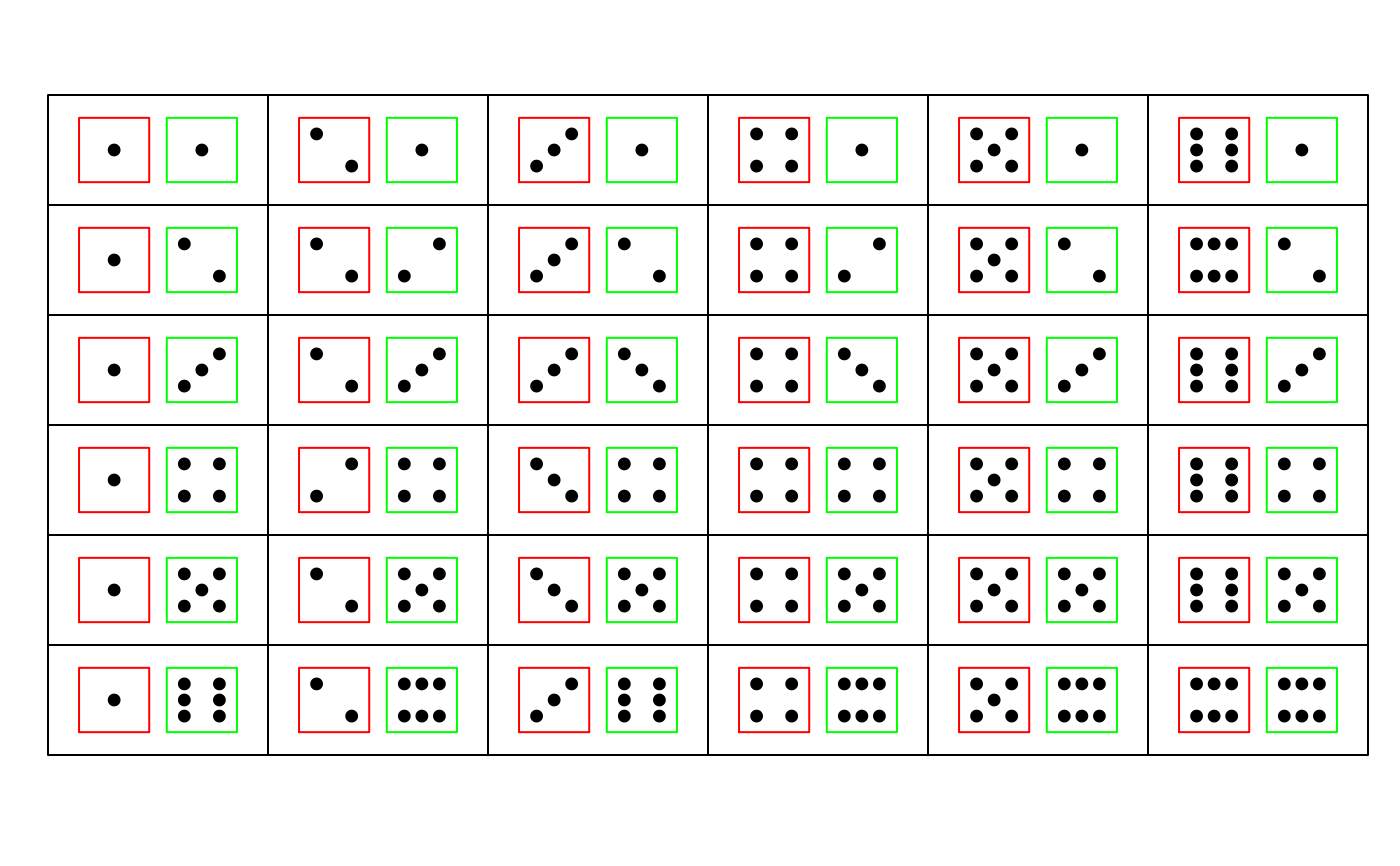
 ## plot all possible combinations of 2 dice
plot.dice( expand.grid(1:6,1:6), layout=c(6,6) )
## plot all possible combinations of 2 dice
plot.dice( expand.grid(1:6,1:6), layout=c(6,6) )