William's % R.
Value
A object of the same class as HLC or a vector (if
try.xts fails) containing the William's %R values.
Details
If an High-Low-Close series is provided, the indicator is calculated using the high/low values. If a vector is provided, the calculation only uses that series.
Note
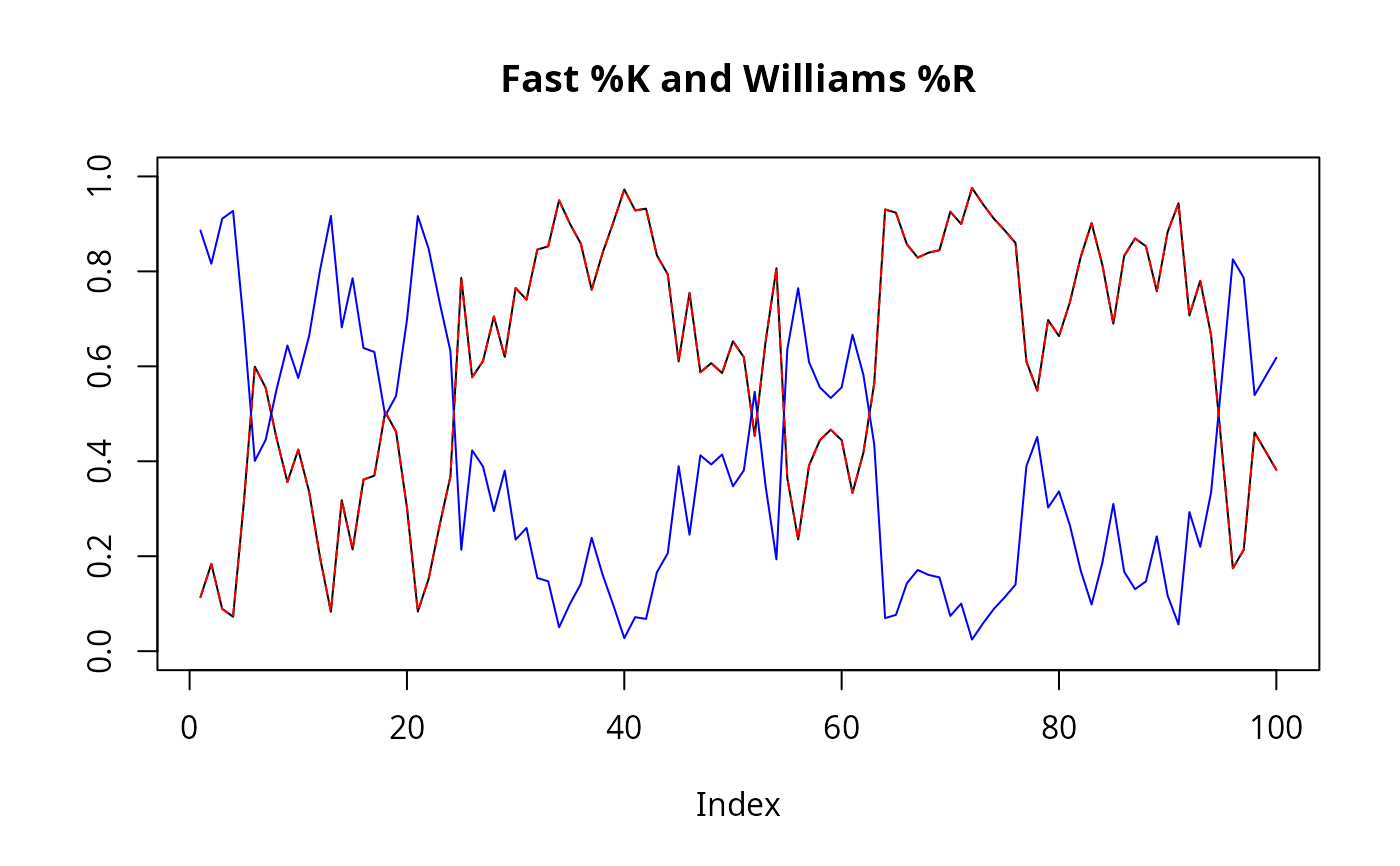
The William's %R calculation is similar to stochastics' fast %K.
The value for William's %R will be 0.5 whenever the highest high and
lowest low are the same over the last n periods.
References
The following site(s) were used to code/document this
indicator:
https://www.fmlabs.com/reference/WilliamsR.htm
https://www.metastock.com/Customer/Resources/TAAZ/?p=126
https://www.linnsoft.com/techind/williams-r-wpr
https://school.stockcharts.com/doku.php?id=technical_indicators:williams_r
See also
See stoch.
Examples
 data(ttrc)
 stochOsc <- stoch(ttrc[,c("High","Low","Close")])
 stochWPR<- WPR(ttrc[,c("High","Low","Close")])

 plot(tail(stochOsc[,"fastK"], 100), type="l",
     main="Fast %K and Williams %R", ylab="",
     ylim=range(cbind(stochOsc, stochWPR), na.rm=TRUE) )
 lines(tail(stochWPR, 100), col="blue")
 lines(tail(1-stochWPR, 100), col="red", lty="dashed")