This function displays text output in a graphics window. It is the equivalent of 'print' except that the output is displayed as a plot.
Usage
replaceTabs.inner(text, width = 8)

replaceTabs(text, width = 8)

textplot(
  object,
  halign = "center",
  valign = "center",
  cex,
  max.cex = 1,
  cmar = 2,
  rmar = 0.5,
  show.rownames = TRUE,
  show.colnames = TRUE,
  hadj = 1,
  vadj = NULL,
  row.valign = "center",
  heading.valign = "bottom",
  mar = c(0, 0, 0, 0) + 0.1,
  col.data = par("col"),
  col.rownames = par("col"),
  col.colnames = par("col"),
  wrap = TRUE,
  wrap.colnames = 10,
  wrap.rownames = 10,
  ...
)

# Default S3 method
textplot(
  object,
  halign = c("center", "left", "right"),
  valign = c("center", "top", "bottom"),
  cex,
  max.cex,
  cmar,
  rmar,
  show.rownames,
  show.colnames,
  hadj,
  vadj,
  row.valign,
  heading.valign,
  mar,
  col.data,
  col.rownames,
  col.colnames,
  wrap,
  wrap.colnames,
  wrap.rownames,
  ...
)

# S3 method for class 'data.frame'
textplot(
  object,
  halign = c("center", "left", "right"),
  valign = c("center", "top", "bottom"),
  cex,
  max.cex = 1,
  cmar = 2,
  rmar = 0.5,
  show.rownames = TRUE,
  show.colnames = TRUE,
  hadj = 1,
  vadj = NULL,
  row.valign = "center",
  heading.valign = "bottom",
  mar = c(0, 0, 0, 0) + 0.1,
  col.data = par("col"),
  col.rownames = par("col"),
  col.colnames = par("col"),
  wrap = TRUE,
  wrap.colnames = 10,
  wrap.rownames = 10,
  ...
)

# S3 method for class 'matrix'
textplot(
  object,
  halign = c("center", "left", "right"),
  valign = c("center", "top", "bottom"),
  cex,
  max.cex = 1,
  cmar = 2,
  rmar = 0.5,
  show.rownames = TRUE,
  show.colnames = TRUE,
  hadj = 1,
  vadj = NULL,
  row.valign = "center",
  heading.valign = "bottom",
  mar = c(0, 0, 0, 0) + 0.1,
  col.data = par("col"),
  col.rownames = par("col"),
  col.colnames = par("col"),
  wrap = TRUE,
  wrap.colnames = 10,
  wrap.rownames = 10,
  ...
)

# S3 method for class 'character'
textplot(
  object,
  halign = c("center", "left", "right"),
  valign = c("center", "top", "bottom"),
  cex,
  max.cex = 1,
  cmar = 2,
  rmar = 0.5,
  show.rownames = TRUE,
  show.colnames = TRUE,
  hadj = 1,
  vadj = NULL,
  row.valign = "center",
  heading.valign = "bottom",
  mar = c(0, 0, 3, 0) + 0.1,
  col.data = par("col"),
  col.rownames = par("col"),
  col.colnames = par("col"),
  wrap = TRUE,
  wrap.colnames = 10,
  wrap.rownames = 10,
  fixed.width = TRUE,
  cspace = 1,
  lspace = 1,
  tab.width = 8,
  ...
)
Arguments
- text
in the function 'replaceTabs', the text string to be processed
- width
in the function 'replaceTabs', the number of spaces to replace tabs with
- object
Object to be displayed.
- halign
Alignment in the x direction, one of "center", "left", or "right".
- valign
Alignment in the y direction, one of "center", "top" , or "bottom"
- cex
Character size, see
parfor details. If unset, the code will attempt to use the largest value which allows the entire object to be displayed.- max.cex
Sets the largest text size as a ceiling
- rmar, cmar
Space between rows or columns, in fractions of the size of the letter 'M'.
- show.rownames, show.colnames
Logical value indicating whether row or column names will be displayed.
- hadj, vadj
Vertical and horizontal location of elements within matrix cells. These have the same meaning as the
adjgraphics paramter (seepar).- row.valign
Sets the vertical alignment of the row as "top", "bottom", or (default) "center".
- heading.valign
Sets the vertical alignment of the heading as "top", (default) "bottom", or "center".
- mar
Figure margins, see the documentation for
par.- col.data
Colors for data elements. If a single value is provided, all data elements will be the same color. If a matrix matching the dimensions of the data is provided, each data element will receive the specified color.
- col.rownames, col.colnames
Colors for row names and column names, respectively. Either may be specified as a scalar or a vector of appropriate length.
- wrap
If TRUE (default), will wrap column names and rownames
- wrap.colnames
The number of characters after which column labels will be wrapped. Default is 10.
- wrap.rownames
The number of characters after which row headings will be wrapped. Default is 10.
- ...
Optional arguments passed to the text plotting command or specialized object methods
- fixed.width
default is TRUE
- cspace
default is 1
- lspace
default is 1
- tab.width
default is 8
Details
A new plot is created and the object is displayed using the largest font
that will fit on in the plotting region. The halign and
valign parameters can be used to control the location of the string
within the plotting region.
For matrixes and vectors a specialized textplot function is available, which plots each of the cells individually, with column widths set according to the sizes of the column elements. If present, row and column labels will be displayed in a bold font.
textplot also uses replaceTabs, a function to replace all tabs in a string with an appropriate number of spaces. That function was also written by Gregory R. Warnes and included in the 'gplots' package.
See also
plot, text, capture.output, textplot
Author
Originally written by Gregory R. Warnes warnes@bst.rochester.edu for the package 'gplots', modified by Peter Carl
Examples
# don't test on CRAN, since it requires Suggested packages
# Also see the examples in the original gplots textplot function
data(managers)
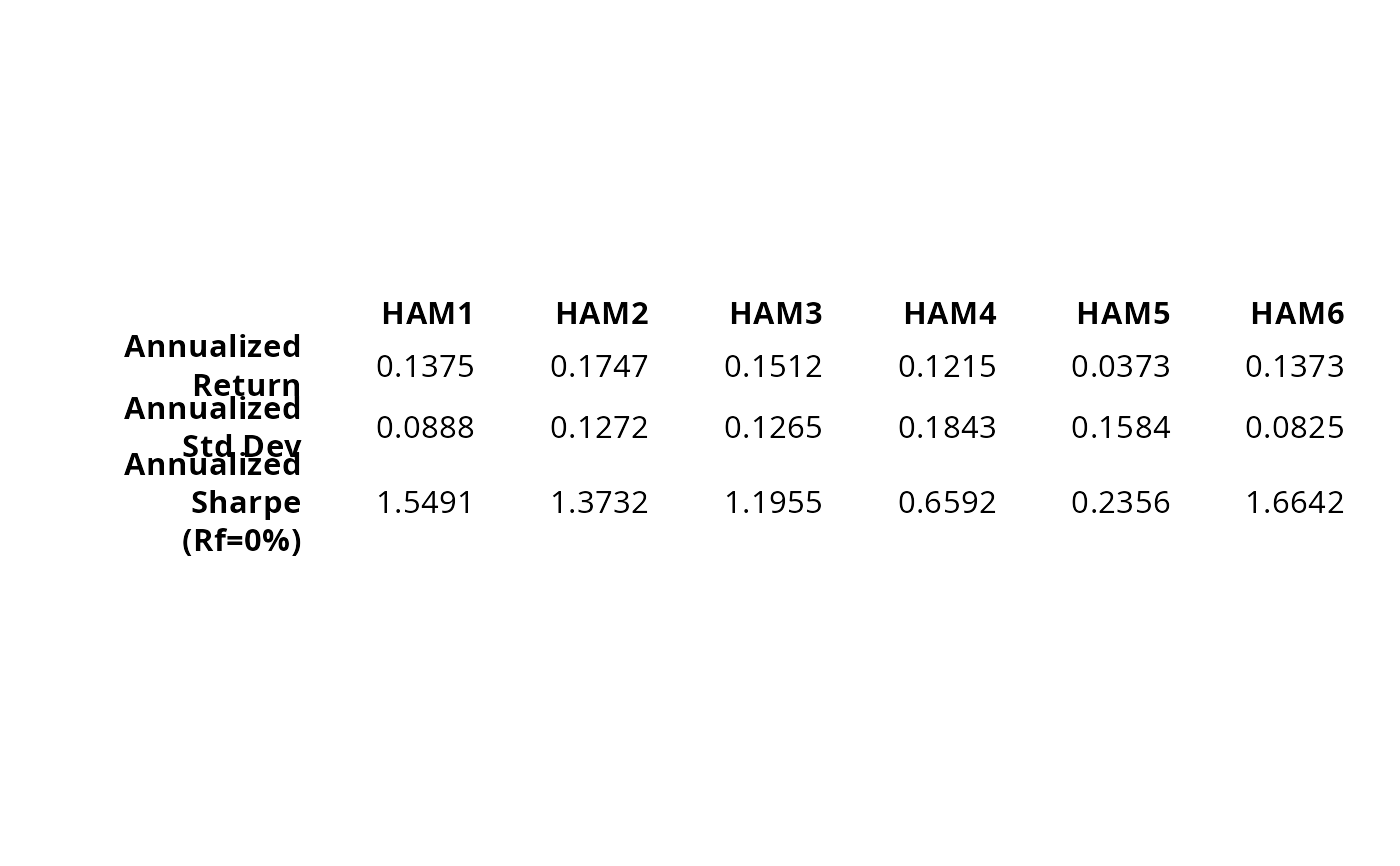
textplot(table.AnnualizedReturns(managers[,1:6]))
 # This was really nice before Hmisc messed up 'format' from R-base
# prettify with format.df in hmisc package
# require("Hmisc")
# result = t(table.CalendarReturns(managers[,1:8]))[-1:-12,]
# textplot(Hmisc::format.df(result, na.blank=TRUE, numeric.dollar=FALSE,
# cdec=rep(1,dim(result)[2])), rmar = 0.8, cmar = 1, max.cex=.9,
# halign = "center", valign = "top", row.valign="center", wrap.rownames=20,
# wrap.colnames=10, col.rownames=c("red", rep("darkgray",5),
# rep("orange",2)), mar = c(0,0,4,0)+0.1)
#
# title(main="Calendar Returns")
# This was really nice before Hmisc messed up 'format' from R-base
# prettify with format.df in hmisc package
# require("Hmisc")
# result = t(table.CalendarReturns(managers[,1:8]))[-1:-12,]
# textplot(Hmisc::format.df(result, na.blank=TRUE, numeric.dollar=FALSE,
# cdec=rep(1,dim(result)[2])), rmar = 0.8, cmar = 1, max.cex=.9,
# halign = "center", valign = "top", row.valign="center", wrap.rownames=20,
# wrap.colnames=10, col.rownames=c("red", rep("darkgray",5),
# rep("orange",2)), mar = c(0,0,4,0)+0.1)
#
# title(main="Calendar Returns")