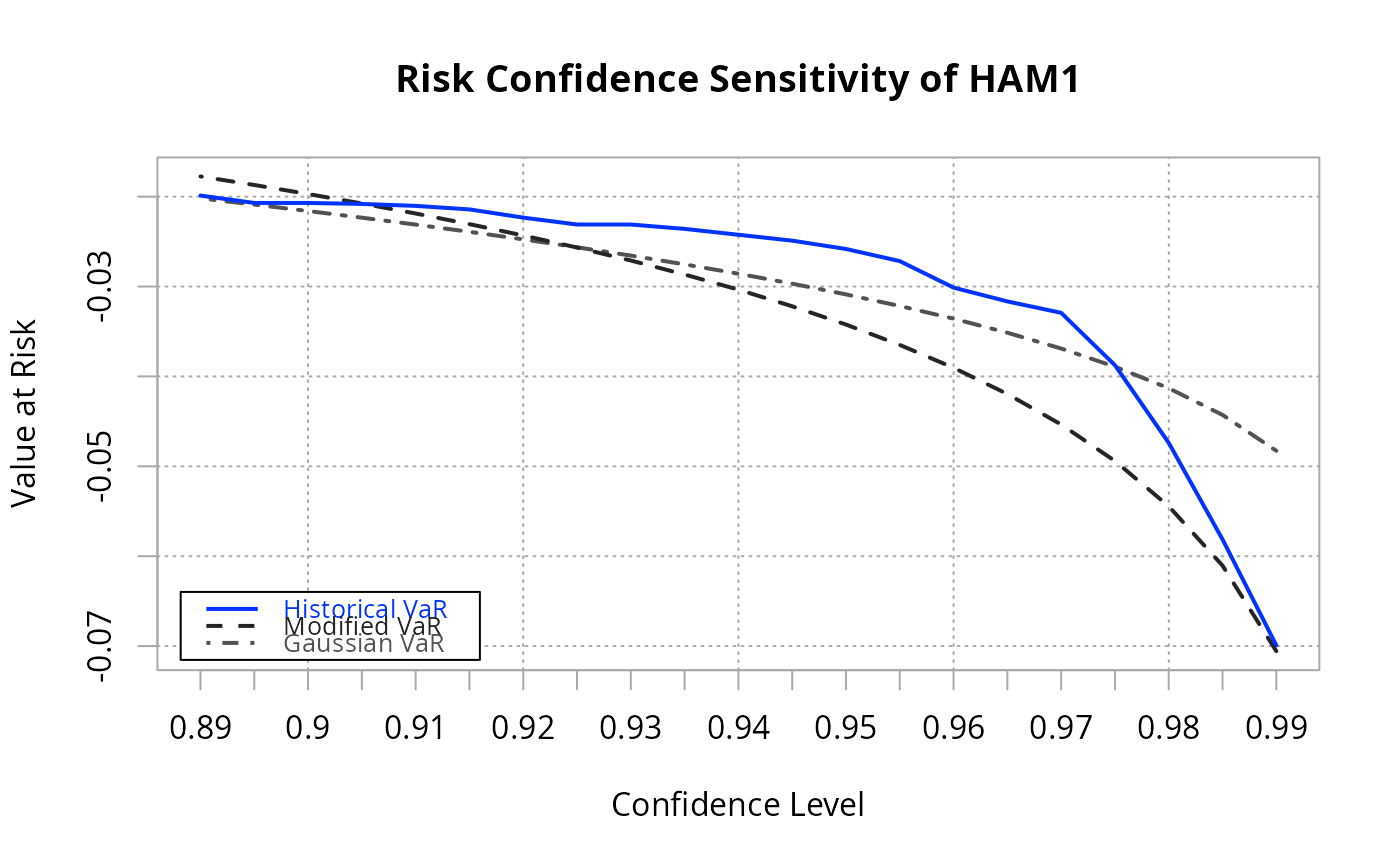
show the sensitivity of Value-at-Risk or Expected Shortfall estimates
Source:R/chart.VaRSensitivity.R
chart.VaRSensitivity.RdCreates a chart of Value-at-Risk and/or Expected Shortfall estimates by confidence interval for multiple methods.
Usage
chart.VaRSensitivity(
  R,
  methods = c("GaussianVaR", "ModifiedVaR", "HistoricalVaR", "GaussianES", "ModifiedES",
    "HistoricalES"),
  clean = c("none", "boudt", "geltner"),
  elementcolor = "darkgray",
  reference.grid = TRUE,
  xlab = "Confidence Level",
  ylab = "Value at Risk",
  type = "l",
  lty = c(1, 2, 4),
  lwd = 1,
  colorset = (1:12),
  pch = (1:12),
  legend.loc = "bottomleft",
  cex.legend = 0.8,
  main = NULL,
  ylim = NULL,
  ...
)
Arguments
- R
an xts, vector, matrix, data frame, timeSeries or zoo object of asset returns
- methods
one or more calculation methods indicated "GaussianVaR", "ModifiedVaR", "HistoricalVaR", "GaussianES", "ModifiedES", "HistoricalES". See
VaRorESfor more detail.- clean
method for data cleaning through
Return.clean. Current options are "none" or "boudt" or "geltner".- elementcolor
the color used to draw chart elements. The default is "darkgray"
- reference.grid
if true, draws a grid aligned with the points on the x and y axes
- xlab
set the x-axis label, same as in
plot- ylab
set the y-axis label, same as in
plot- type
set the chart type, same as in
plot- lty
set the line type, same as in
plot- lwd
set the line width, same as in
plot- colorset
color palette to use, set by default to rational choices
- pch
symbols to use, see also
plot- legend.loc
places a legend into one of nine locations on the chart: bottomright, bottom, bottomleft, left, topleft, top, topright, right, or center.
- cex.legend
The magnification to be used for sizing the legend relative to the current setting of 'cex'.
- main
set the chart title, same as in
plot- ylim
set the y-axis dimensions, same as in
plot- ...
any other passthru parameters
Details
This chart shows estimated VaR along a series of confidence intervals for selected calculation methods. Useful for comparing a method to the historical VaR calculation.