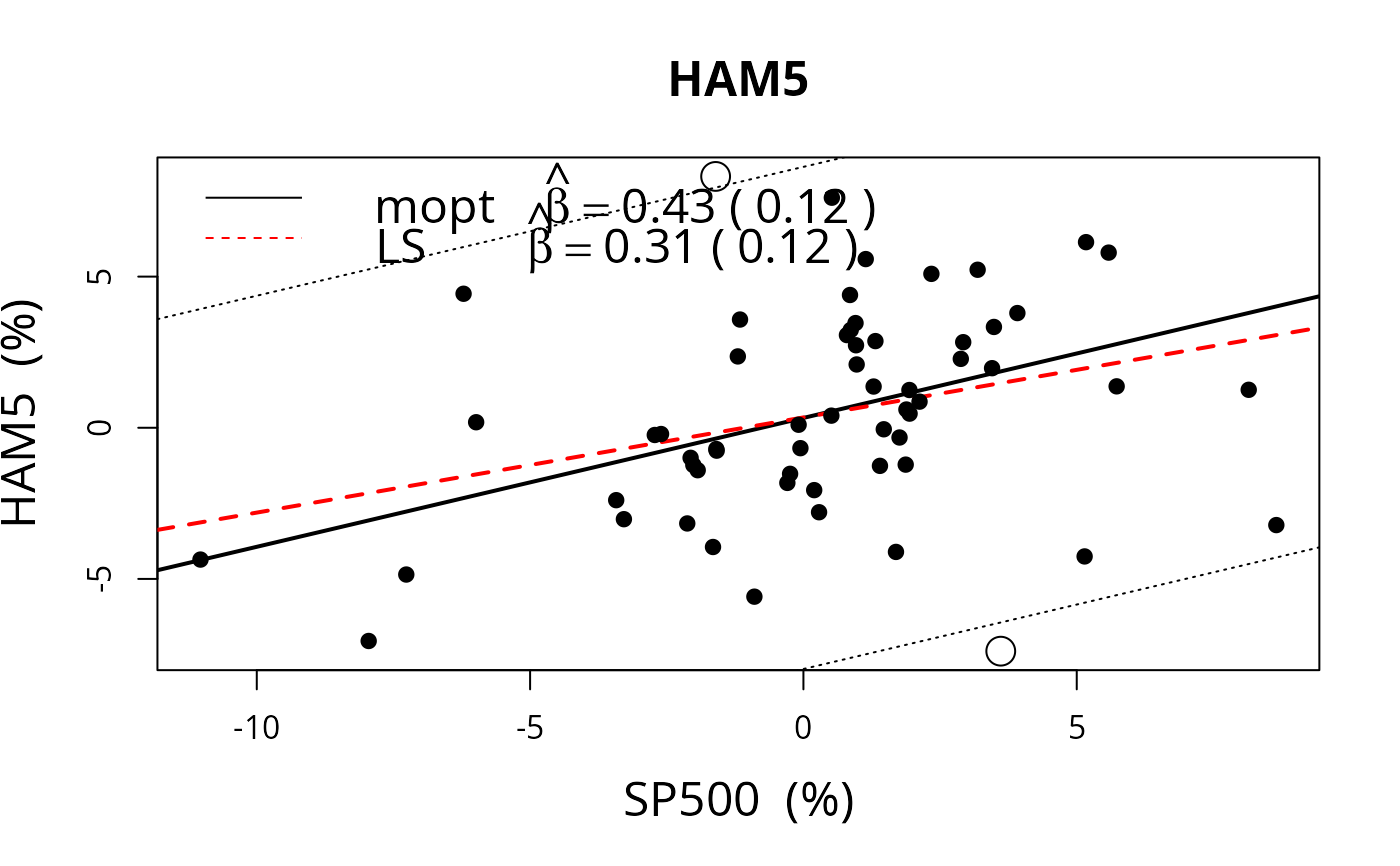
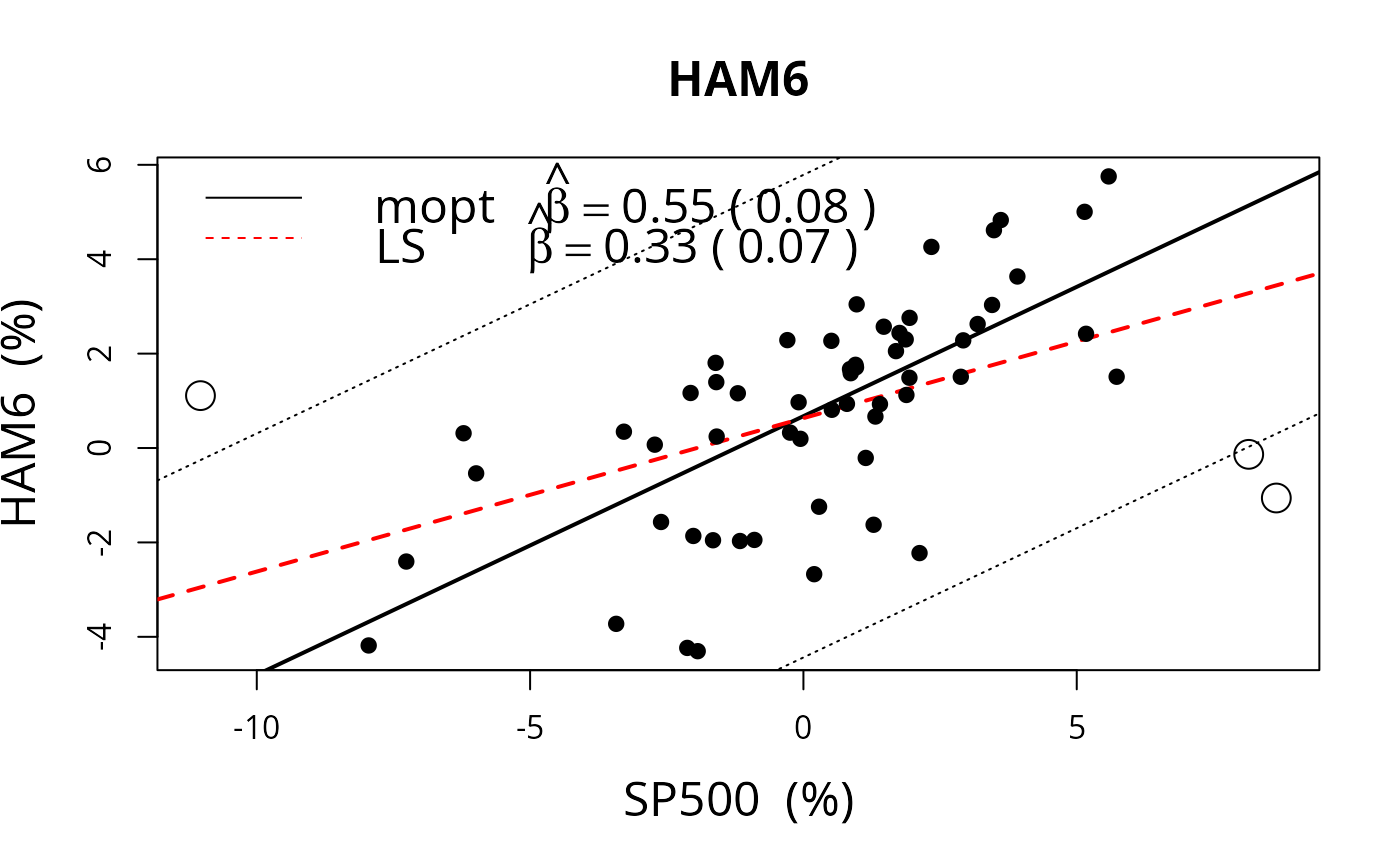
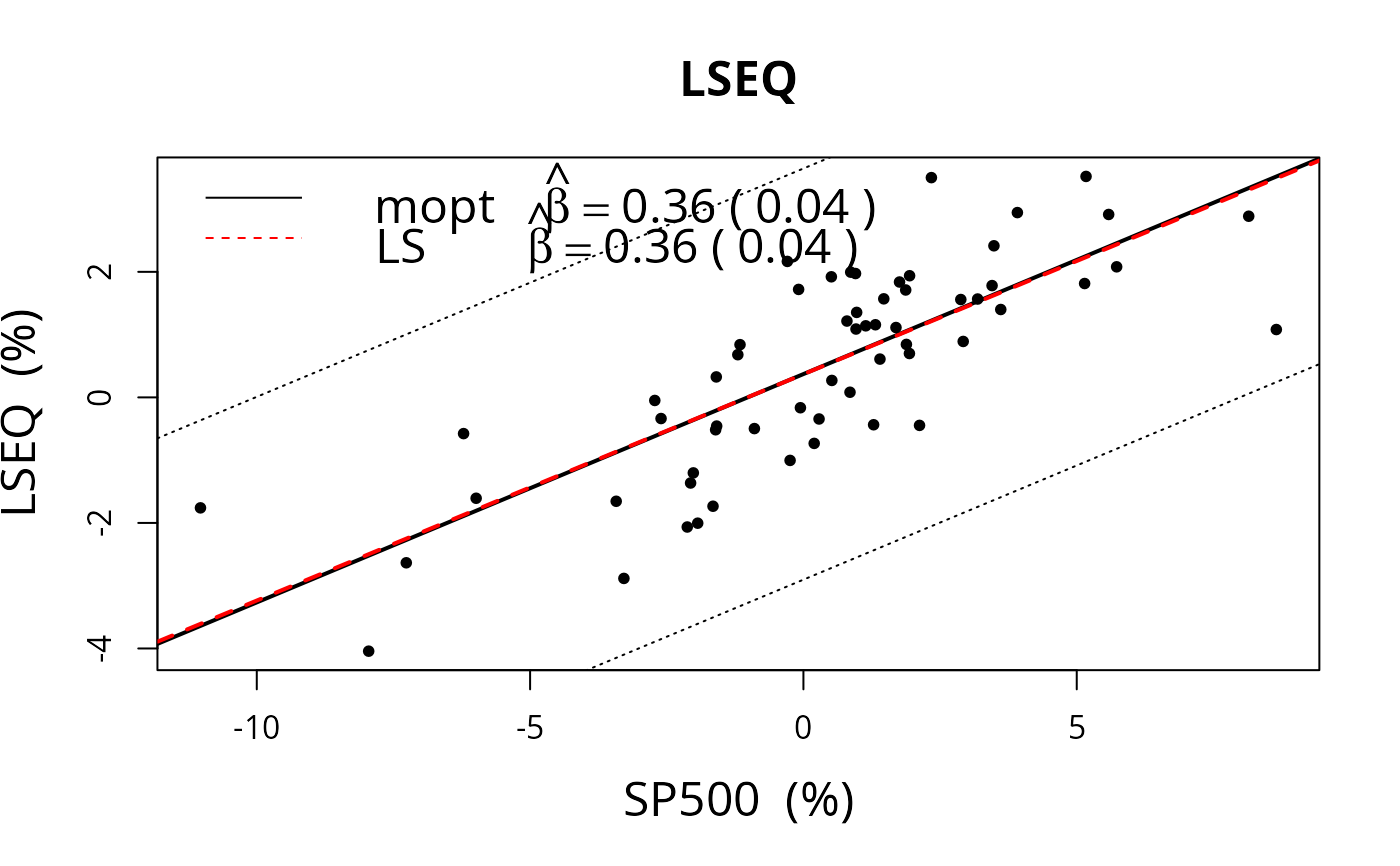
Compare SFM estimated using robust estimators with that estimated by OLS
Source:R/chart.SFM.R
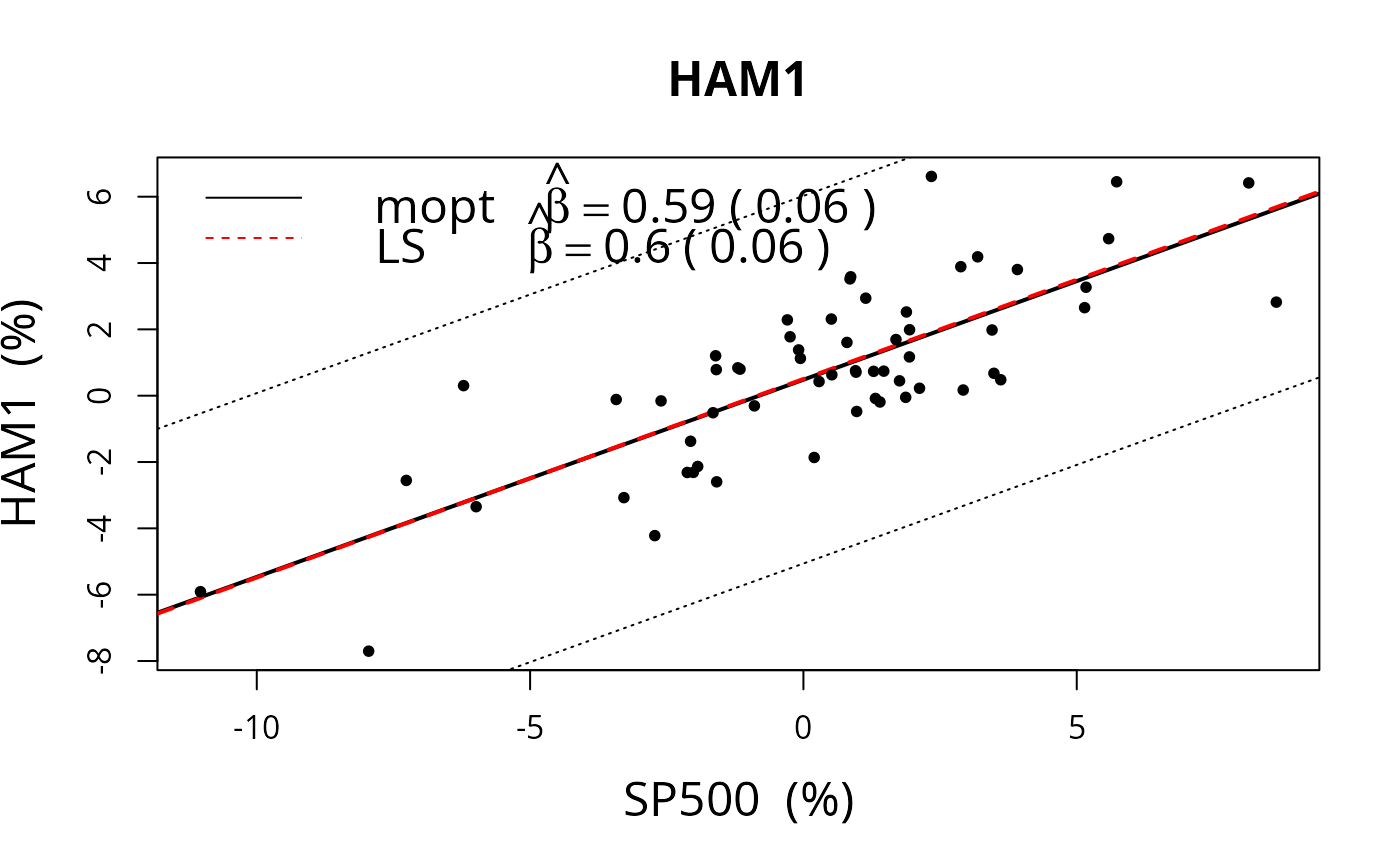
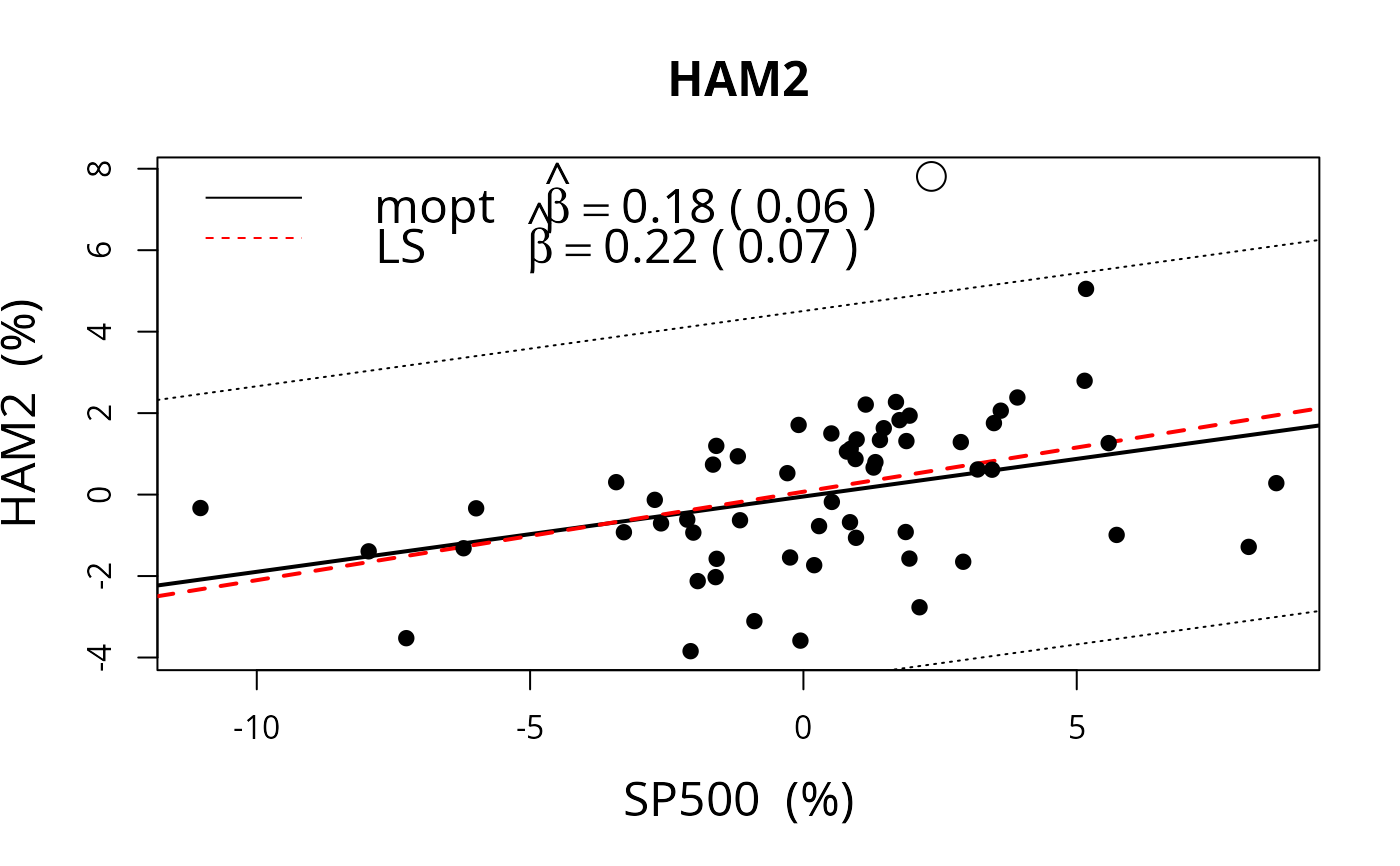
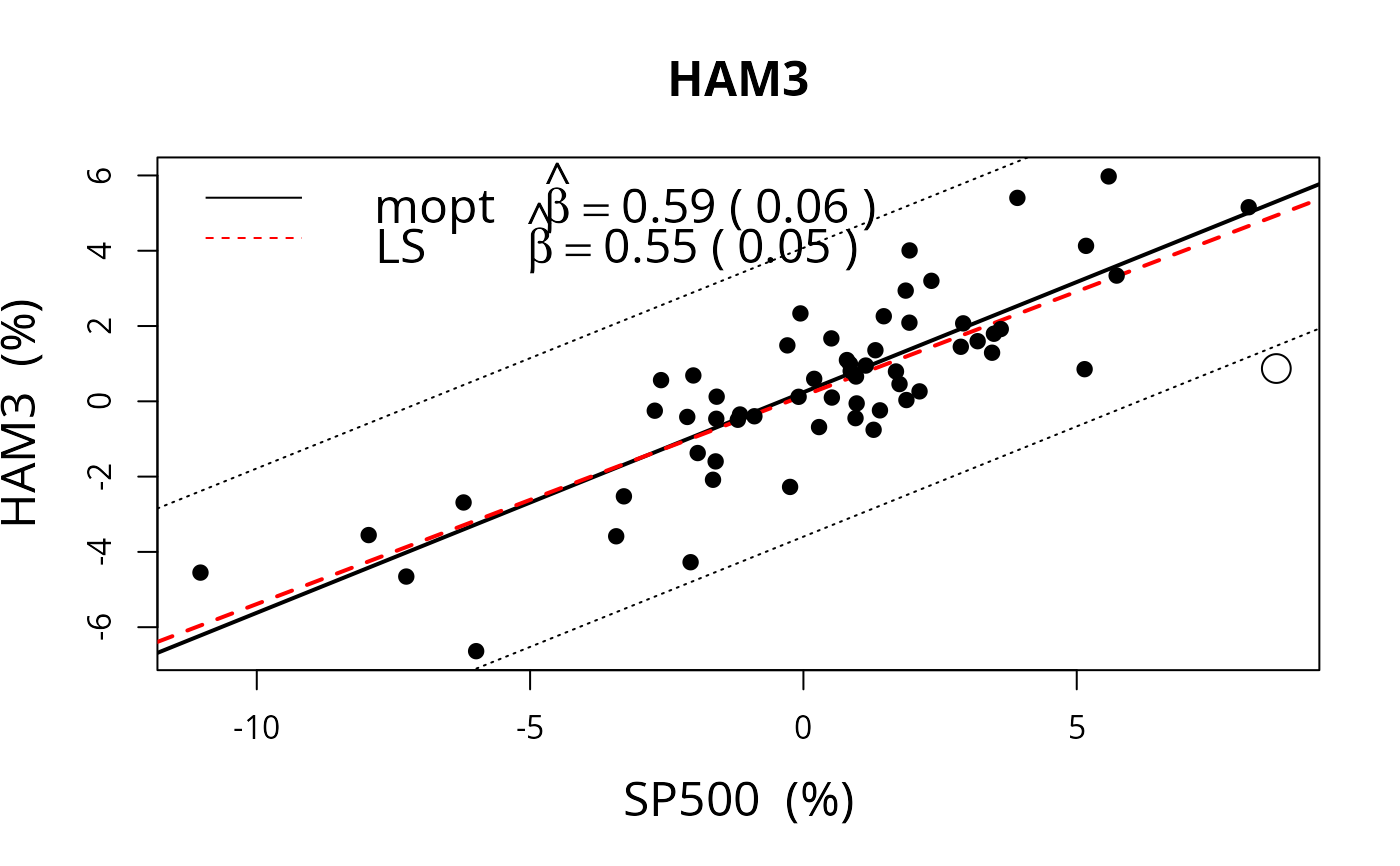
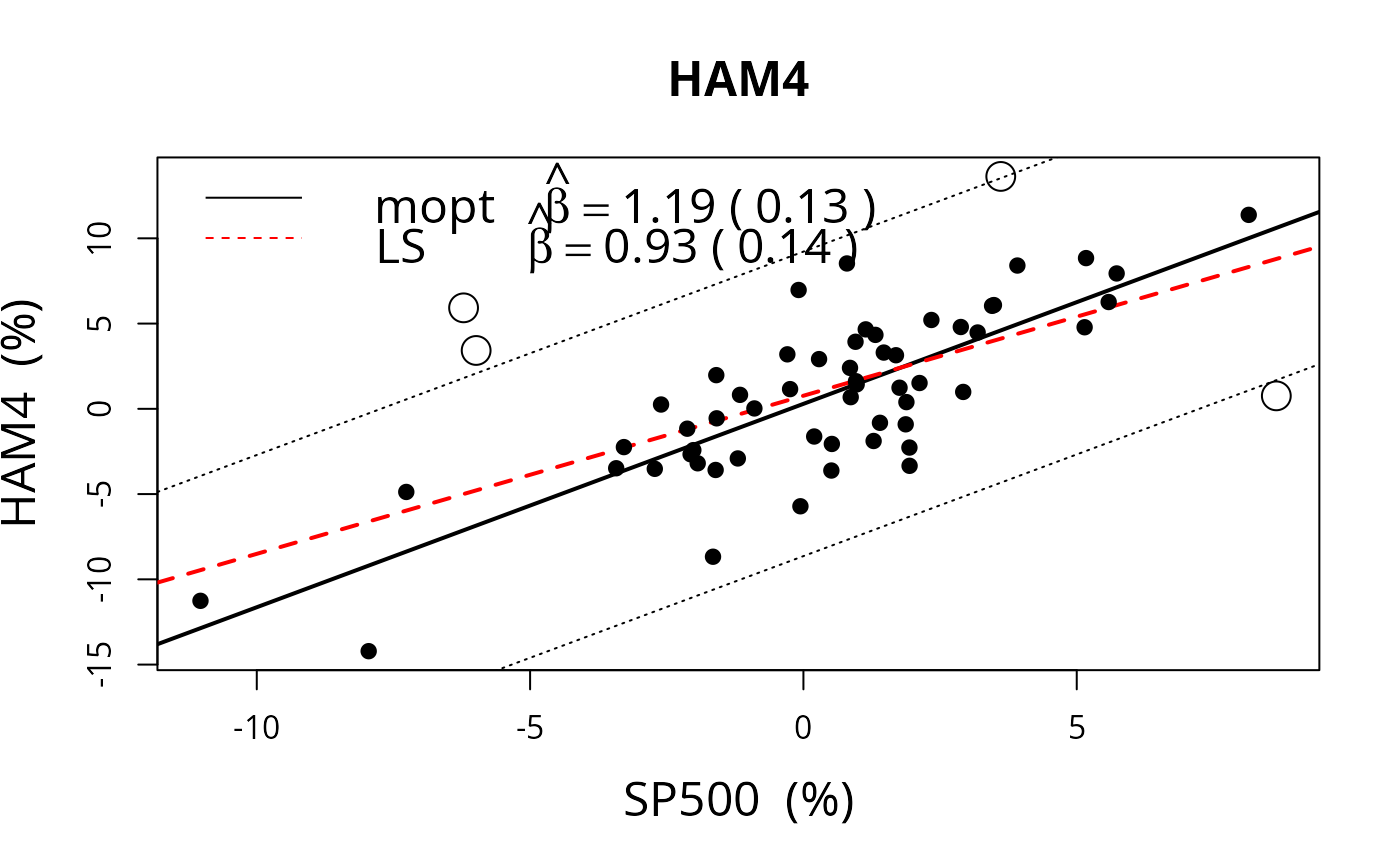
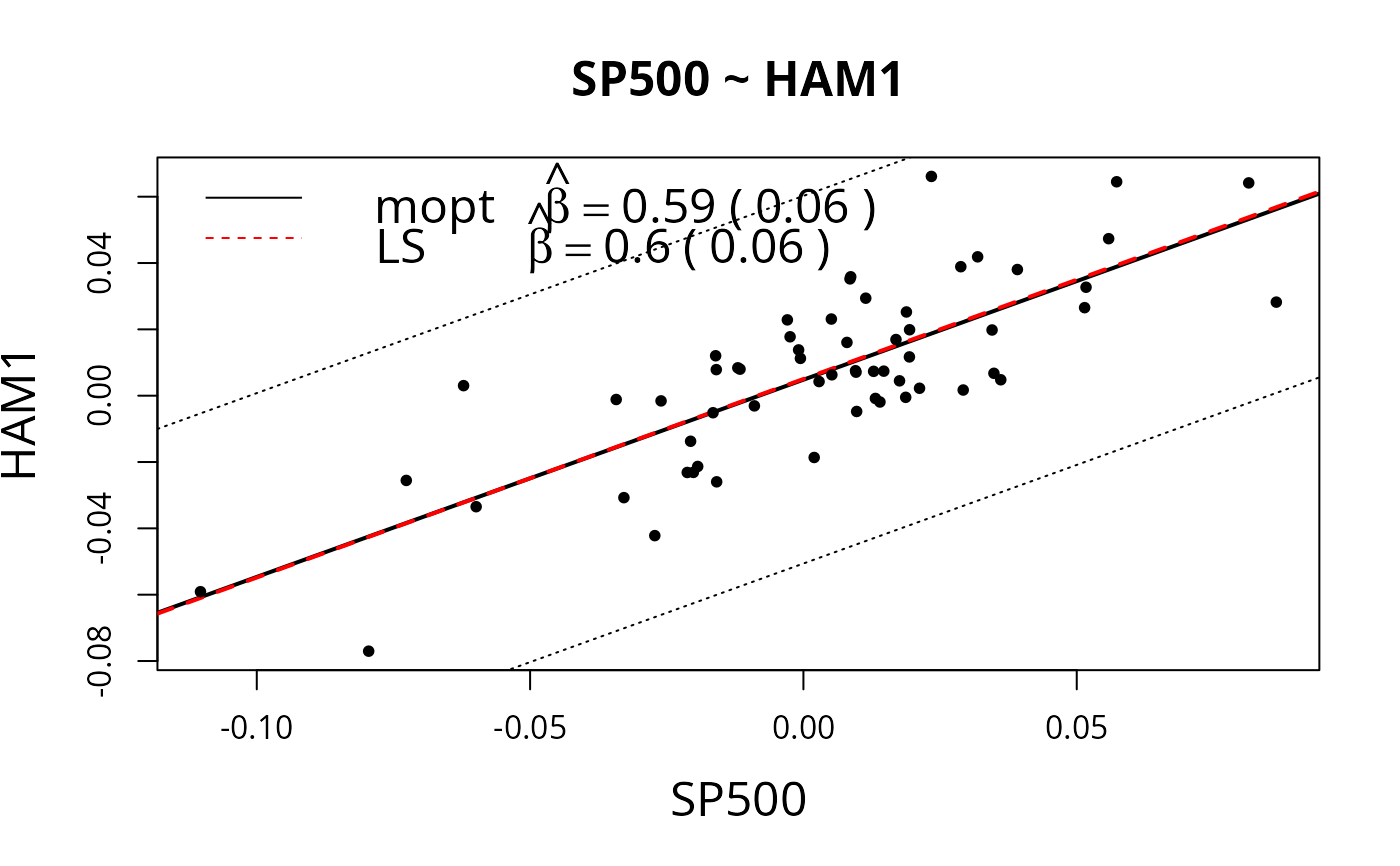
chart.SFM.RdThis function for single factor models (SFM’s) with a slope and intercept allows the user to easily make a scatter plot of asset returns versus benchmark returns, such as the SP500, with two overlaid straight-line fits, one obtained using least squares (LS), which can be very adversely influenced by outliers, and one obtained using a highly robust regression estimate that is not much influenced by outliers. The plot allows the user to see immediately whether or not any outliers result in a distorted LS fit that does not fit the bulk of the data, while the robust estimator results In a good fit to the bulk of the data. The plot contains a legend with LS slope estimate and the robust slope estimate, with estimate standard errors in parentheses.
Usage
chart.SFM(
  Ra,
  Rb,
  Rf = 0,
  main = NULL,
  ylim = NULL,
  xlim = NULL,
  family = "mopt",
  xlab = NULL,
  ylab = NULL,
  legend.loc = "topleft",
  makePct = FALSE
)
Arguments
- Ra
an xts, vector, matrix, data frame, timeSeries or zoo object of asset returns
- Rb
return vector of the benchmark asset
- Rf
risk free rate, in same period as your returns
- main
Title of the generated plot. Defaults to "lm vs lmRobdetMM"
- ylim
Limits on the y-axis of the plots. Defaults to min-max
- xlim
Limits on the x-axis of the plots. Defaults to min-max
- family
(Optional): This is a string specifying the name of the family of loss function to be used (current valid options are "bisquare", "opt" and "mopt"). Incomplete entries will be matched to the current valid options. Defaults to "mopt".
- xlab
Title of the x-axis of the plots. Defaults to "Benchmark Returns"
- ylab
Title of the y-axis of the plots. Defaults to "Asset Returns"
- legend.loc
Position of legends. See plot() function for more info.
- makePct
If Returns should be converted to percentage. Defaults to False
Details
The function chart.SFM computes the robust fit with the function lmrobdetMM contained in the package RobStatTM available at CRAN. The function lmrobdetMM has a default robust regression estimate called the mopt estimate, which is used by chart.SFM. For details on lmrobdetMM, see reference [1]. The plot made by chart.SFM has two parallel dotted lines that define a strip in the asset returns versus benchmark returns space, and data points that fall outside that strip are defined as outliers, and as such are rejected, i.e., deleted by the lmrobdetMM estimator.
References
Martin, R. D. and Xia, D. Z. (2021). Robust Time Series Factor Models,
SSRN: https://www.ssrn.com/abstract=3905345. To appear in the Journal of Asset Management in 2022
Ruppert, David. Statistics and Finance, an
Introduction. Springer. 2004.
Sharpe, W.F. Capital Asset Prices: A theory of market
equilibrium under conditions of risk. Journal of finance, vol 19,
1964, 425-442.
Examples
# CRAN tests if Suggested packages are loaded
data(managers)
mgrs <- managers["2002/"] # So that all have managers have complete history
names(mgrs)[7:10] <- c("LSEQ","SP500","Bond10Yr","RF") # Short names for last 3
plot.zoo(mgrs)
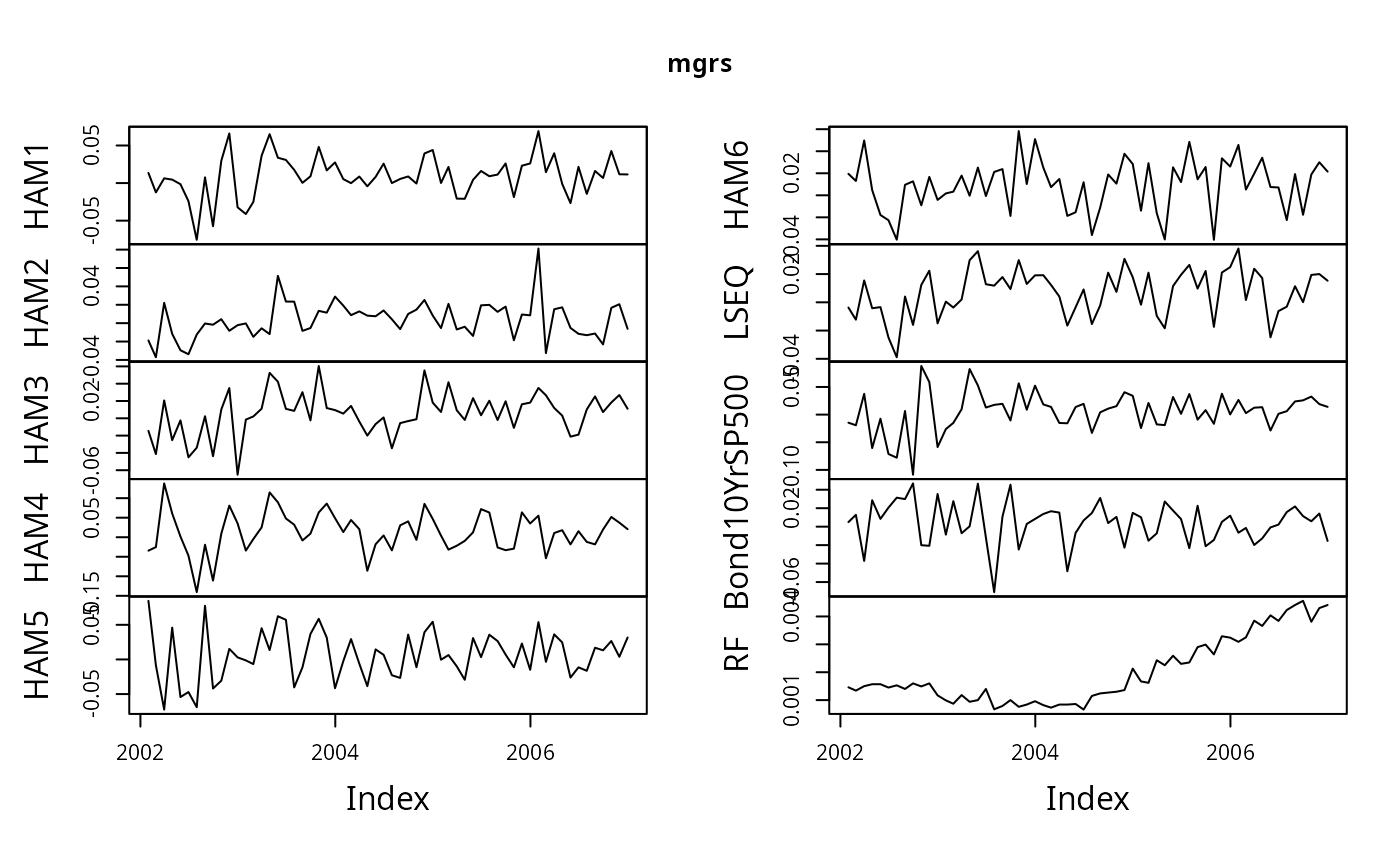 chart.SFM(mgrs$HAM1, mgrs$SP500, Rf=mgrs$RF)
 for(k in 1:7){
chart.SFM(mgrs[,k],mgrs$SP500,mgrs$RF,makePct = TRUE,
main = names(mgrs[,k]))
}
for(k in 1:7){
chart.SFM(mgrs[,k],mgrs$SP500,mgrs$RF,makePct = TRUE,
main = names(mgrs[,k]))
}