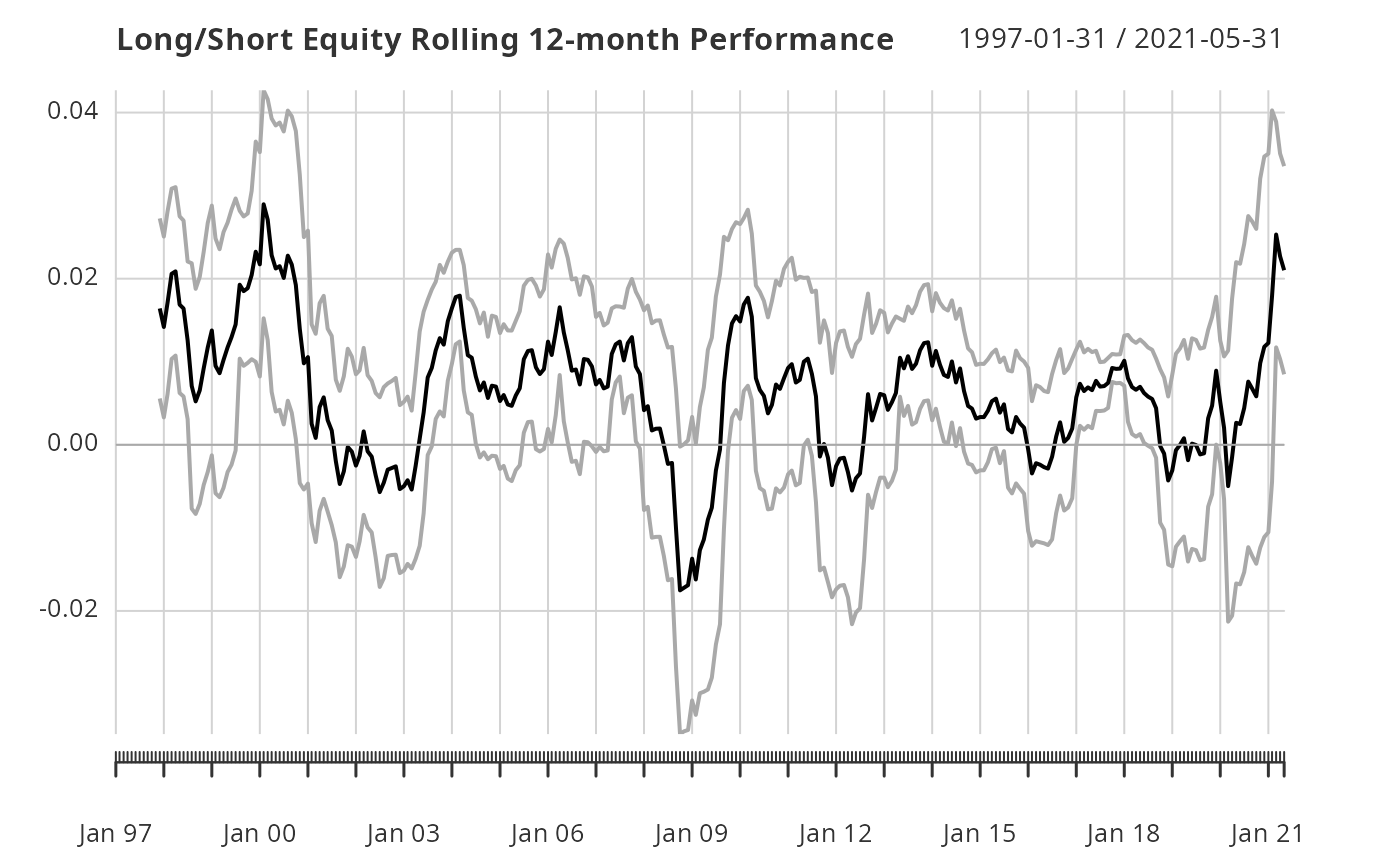
A wrapper to create a rolling mean return chart with 95
Usage
chart.RollingMean(
  R,
  width = 12,
  xaxis = TRUE,
  ylim = NULL,
  lwd = c(2, 1, 1),
  ...,
  fill = NA
)
Arguments
- R
an xts, vector, matrix, data frame, timeSeries or zoo object of asset returns
- width
number of periods to apply rolling function window over
- xaxis
if true, draws the x axis
- ylim
set the y-axis limit, same as in
plot- lwd
set the line width, same as in
plot. Specified in order of the main line and the two confidence bands.- ...
any other passthru parameters
- fill
a three-component vector or list (recycled otherwise) providing filling values at the left/within/to the right of the data range. See the fill argument of
na.fillfor details.
Details
The previous parameter na.pad has been replaced with fill; use fill = NA instead of
na.pad = TRUE, or fill = NULL instead of na.pad = FALSE.
Examples
data(edhec)
chart.RollingMean(edhec[, 9, drop = FALSE])