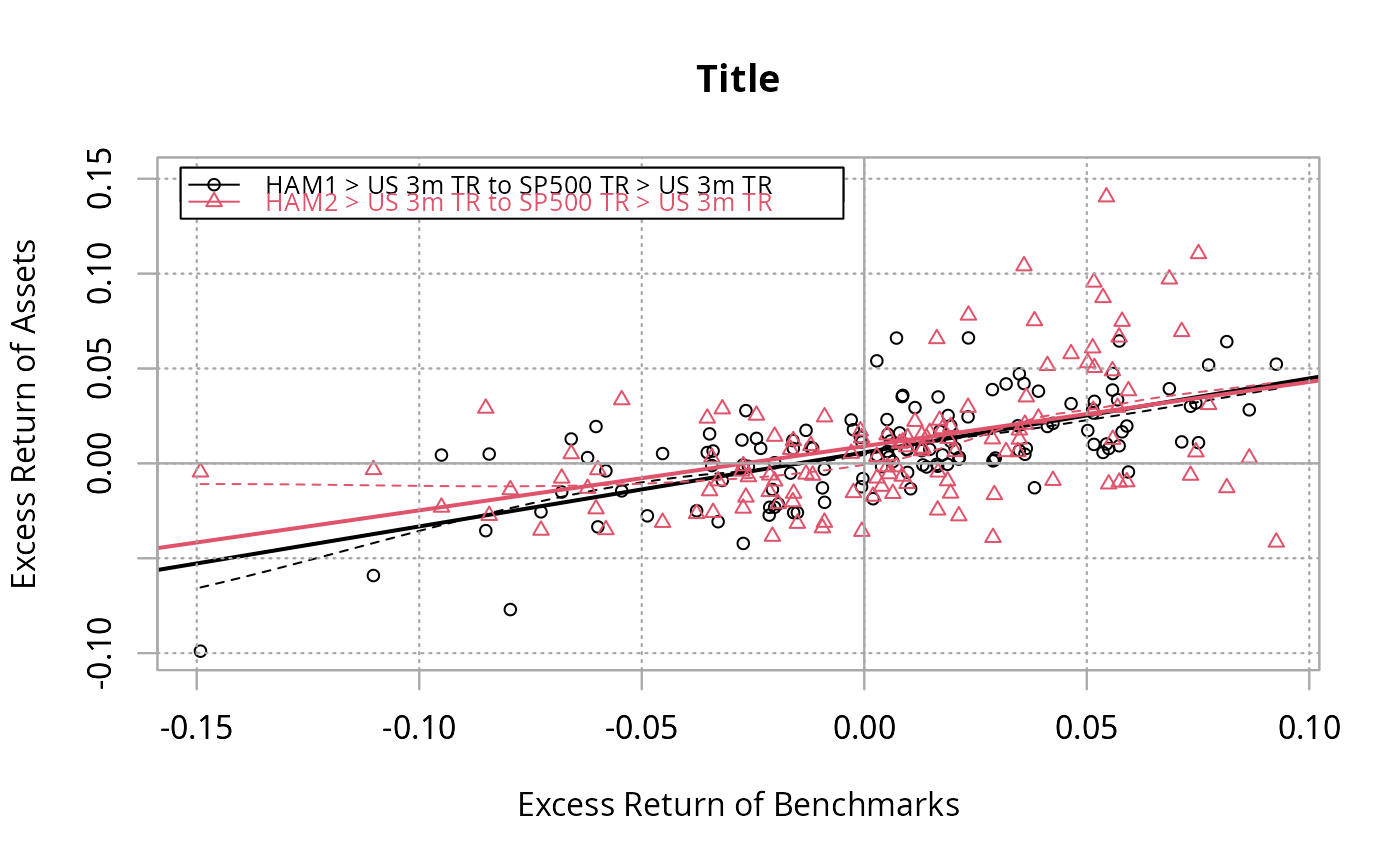
Takes a set of returns and relates them to a market benchmark in a scatterplot
Source:R/chart.Regression.R
chart.Regression.RdUses a scatterplot to display the relationship of a set of returns to a market benchmark. Fits a linear model and overlays the resulting model. Also overlays a Loess line for comparison.
Usage
chart.Regression(
  Ra,
  Rb,
  Rf = 0,
  excess.returns = FALSE,
  reference.grid = TRUE,
  main = "Title",
  ylab = NULL,
  xlab = NULL,
  xlim = NA,
  colorset = 1:12,
  symbolset = 1:12,
  element.color = "darkgray",
  legend.loc = NULL,
  ylog = FALSE,
  fit = c("loess", "linear", "conditional", "quadratic"),
  span = 2/3,
  degree = 1,
  family = c("symmetric", "gaussian"),
  ylim = NA,
  evaluation = 50,
  legend.cex = 0.8,
  cex = 0.8,
  lwd = 2,
  ...
)
Arguments
- Ra
a vector of returns to test, e.g., the asset to be examined
- Rb
a matrix, data.frame, or timeSeries of benchmark(s) to test the asset against
- Rf
risk free rate, in same period as the returns
- excess.returns
logical; should excess returns be used?
- reference.grid
if true, draws a grid aligned with the points on the x and y axes
- main
set the chart title, same as in
plot- ylab
set the y-axis title, same as in
plot- xlab
set the x-axis title, same as in
plot- xlim
set the x-axis limit, same as in
plot- colorset
color palette to use
- symbolset
symbols to use, see also 'pch' in
plot- element.color
provides the color for drawing chart elements, such as the box lines, axis lines, etc. Default is "darkgray"
- legend.loc
places a legend into one of nine locations on the chart: bottomright, bottom, bottomleft, left, topleft, top, topright, right, or center.
- ylog
Not used
- fit
for values of "loess", "linear", or "conditional", plots a line to fit the data. Conditional lines are drawn separately for positive and negative benchmark returns. "Quadratic" is not yet implemented.
- span
passed to loess line fit, as in
loess.smooth- degree
passed to loess line fit, as in
loess.smooth- family
passed to loess line fit, as in
loess.smooth- ylim
set the y-axis limit, same as in
plot- evaluation
passed to loess line fit, as in
loess.smooth- legend.cex
set the legend size
- cex
set the cex size, same as in
plot- lwd
set the line width for fits, same as in
lines- ...
any other passthru parameters to
plot
References
Chapter 7 of Ruppert(2004) gives an extensive overview of CAPM, its assumptions and deficiencies.