Plot the return data against any theoretical distribution.
Usage
chart.QQPlot(
  R,
  distribution = "norm",
  ylab = NULL,
  xlab = paste(distribution, "Quantiles"),
  main = NULL,
  las = par("las"),
  envelope = FALSE,
  labels = FALSE,
  col = c(1, 4),
  lwd = 2,
  pch = 1,
  cex = 1,
  line = c("quartiles", "robust", "none"),
  element.color = "darkgray",
  cex.axis = 0.8,
  cex.legend = 0.8,
  cex.lab = 1,
  cex.main = 1,
  xaxis = TRUE,
  yaxis = TRUE,
  ylim = NULL,
  distributionParameter = NULL,
  ...
)
Arguments
- R
an xts, vector, matrix, data frame, timeSeries or zoo object of asset returns
- distribution
root name of comparison distribution - e.g., 'norm' for the normal distribution; 't' for the t-distribution. See examples for other ideas.
- ylab
set the y-axis label, as in
plot- xlab
set the x-axis label, as in
plot- main
set the chart title, same as in
plot- las
set the direction of axis labels, same as in
plot- envelope
confidence level for point-wise confidence envelope, or FALSE for no envelope.
- labels
vector of point labels for interactive point identification, or FALSE for no labels.
- col
color for points and lines; the default is the second entry in the current color palette (see 'palette' and 'par').
- lwd
set the line width, as in
plot- pch
symbols to use, see also
plot- cex
symbols to use, see also
plot- line
'quartiles' to pass a line through the quartile-pairs, or 'robust' for a robust-regression line; the latter uses the 'rlm' function in the 'MASS' package. Specifying 'line = "none"' suppresses the line.
- element.color
provides the color for drawing chart elements, such as the box lines, axis lines, etc. Default is "darkgray"
- cex.axis
The magnification to be used for axis annotation relative to the current setting of 'cex'
- cex.legend
The magnification to be used for sizing the legend relative to the current setting of 'cex'
- cex.lab
The magnification to be used for x- and y-axis labels relative to the current setting of 'cex'
- cex.main
The magnification to be used for the main title relative to the current setting of 'cex'.
- xaxis
if true, draws the x axis
- yaxis
if true, draws the y axis
- ylim
set the y-axis limits, same as in
plot- distributionParameter
a string of the parameters of the distribution e.g., distributionParameter = 'location = 1, scale = 2, shape = 3, df = 4' for skew-T distribution
- ...
any other passthru parameters to the distribution function
Details
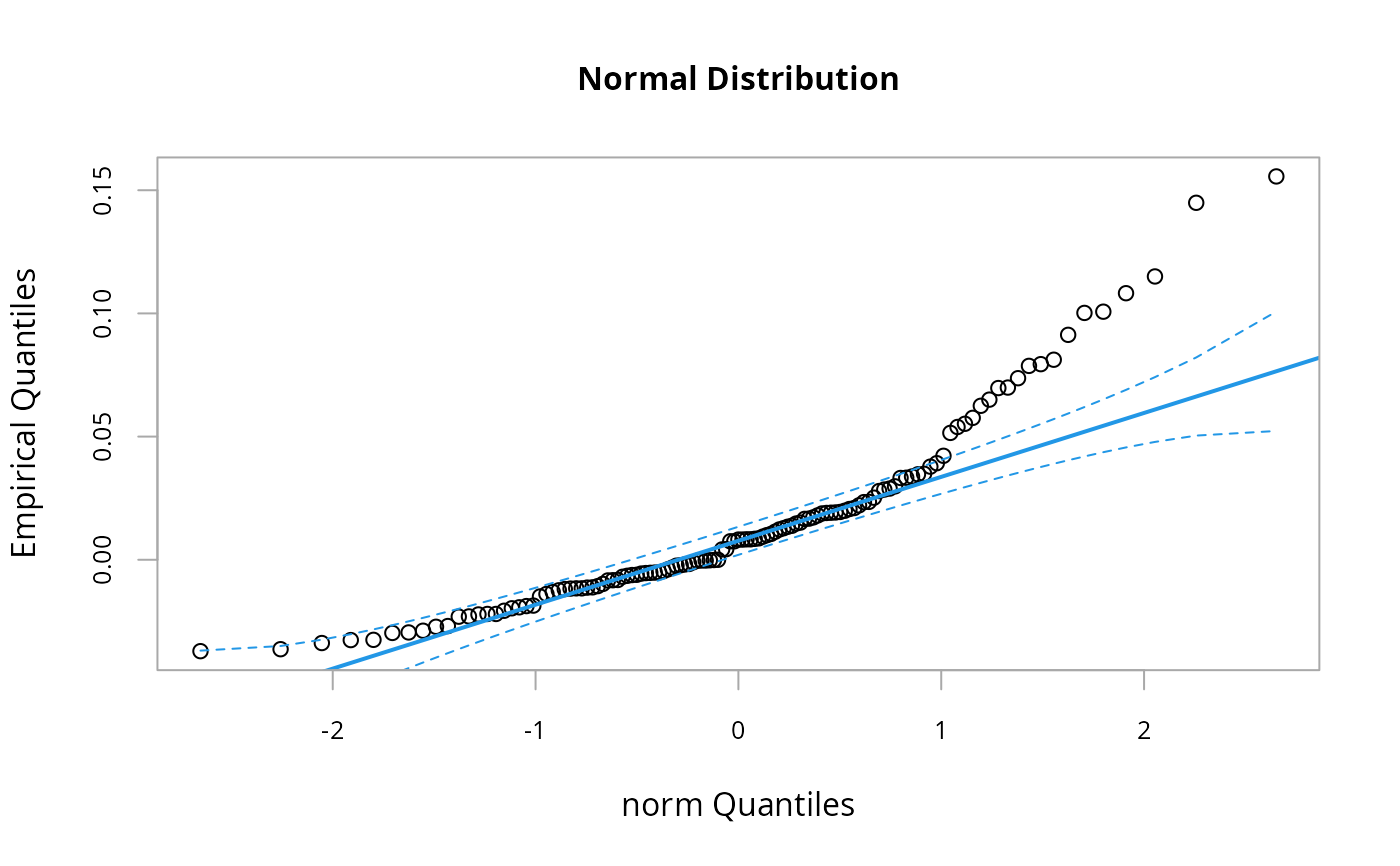
A Quantile-Quantile (QQ) plot is a scatter plot designed to compare the data to the theoretical distributions to visually determine if the observations are likely to have come from a known population. The empirical quantiles are plotted to the y-axis, and the x-axis contains the values of the theorical model. A 45-degree reference line is also plotted. If the empirical data come from the population with the choosen distribution, the points should fall approximately along this reference line. The larger the departure from the reference line, the greater the evidence that the data set have come from a population with a different distribution.
References
main code forked/borrowed/ported from the excellent:
Fox,
John (2007) car: Companion to Applied Regression
https://socserv.socsci.mcmaster.ca/jfox/
Examples
# you'll need lots of extra packages to run these examples of different distributions
if (FALSE) # these examples require multiple packages from 'Suggests', so don't test on CRAN
library(MASS)
library(PerformanceAnalytics)
data(managers)
x = checkData(managers[,2, drop = FALSE], na.rm = TRUE, method = "vector")
# Panel 1: Normal distribution
chart.QQPlot(x, main = "Normal Distribution",
line=c("quartiles"), distribution = 'norm',
envelope=0.95)
 # Panel 2, Log-Normal distribution
fit = fitdistr(1+x, 'lognormal')
#> Error in fitdistr(1 + x, "lognormal"): could not find function "fitdistr"
chart.QQPlot(1+x, main = "Log-Normal Distribution", envelope=0.95,
distribution='lnorm',distributionParameter='meanlog = fit$estimate[[1]],
sdlog = fit$estimate[[2]]')
#> Error in eval(parse(text = paste("\tz <- q.function(P,", distributionParameter, ",...)"))): object 'fit' not found
# Panel 3: Mixture Normal distribution
# library(nor1mix)
obj = norMixEM(x,m=2)
#> Error in norMixEM(x, m = 2): could not find function "norMixEM"
chart.QQPlot(x, main = "Normal Mixture Distribution",
line=c("quartiles"), distribution = 'norMix', distributionParameter='obj',
envelope=0.95)
#> Error in eval(parse(text = paste("q", distribution, sep = ""))): object 'qnorMix' not found
# Panel 4: Symmetric t distribution
library(sn)
#> Error in library(sn): there is no package called ‘sn’
n = length(x)
fit.tSN = st.mple(as.matrix(rep(1,n)),x,symmetr = TRUE)
#> Error in st.mple(as.matrix(rep(1, n)), x, symmetr = TRUE): could not find function "st.mple"
names(fit.tSN$dp) = c("location","scale","dof")
#> Error: object 'fit.tSN' not found
round(fit.tSN$dp,3)
#> Error: object 'fit.tSN' not found
chart.QQPlot(x, main = "MO Symmetric t-Distribution QQPlot",
xlab = "quantilesSymmetricTdistEst",line = c("quartiles"),
envelope = .95, distribution = 't',
distributionParameter='df=fit.tSN$dp[3]',pch = 20)
#> Error in eval(parse(text = paste("\tz <- q.function(P,", distributionParameter, ",...)"))): object 'fit.tSN' not found
# Panel 5: Skewed t distribution
fit.st = st.mple(as.matrix(rep(1,n)),x)
#> Error in st.mple(as.matrix(rep(1, n)), x): could not find function "st.mple"
# fit.st = st.mple(y=x) Produces same result as line above
names(fit.st$dp) = c("location","scale","skew","dof")
#> Error: object 'fit.st' not found
round(fit.st$dp,3)
#> Error: object 'fit.st' not found
chart.QQPlot(x, main = "MO Returns Skewed t-Distribution QQPlot",
xlab = "quantilesSkewedTdistEst",line = c("quartiles"),
envelope = .95, distribution = 'st',
distributionParameter = 'xi = fit.st$dp[1],
omega = fit.st$dp[2],alpha = fit.st$dp[3],
nu=fit.st$dp[4]',
pch = 20)
#> Error in eval(parse(text = paste("q", distribution, sep = ""))): object 'qst' not found
# Panel 6: Stable Parietian
library(fBasics)
#> Error in library(fBasics): there is no package called ‘fBasics’
fit.stable = stableFit(x,doplot=FALSE)
#> Error in stableFit(x, doplot = FALSE): could not find function "stableFit"
chart.QQPlot(x, main = "Stable Paretian Distribution", envelope=0.95,
distribution = 'stable',
distributionParameter = 'alpha = fit(stable.fit)$estimate[[1]],
beta = fit(stable.fit)$estimate[[2]],
gamma = fit(stable.fit)$estimate[[3]],
delta = fit(stable.fit)$estimate[[4]], pm = 0')
#> Error in eval(parse(text = paste("q", distribution, sep = ""))): object 'qstable' not found
# \dontrun{}
#end examples
# Panel 2, Log-Normal distribution
fit = fitdistr(1+x, 'lognormal')
#> Error in fitdistr(1 + x, "lognormal"): could not find function "fitdistr"
chart.QQPlot(1+x, main = "Log-Normal Distribution", envelope=0.95,
distribution='lnorm',distributionParameter='meanlog = fit$estimate[[1]],
sdlog = fit$estimate[[2]]')
#> Error in eval(parse(text = paste("\tz <- q.function(P,", distributionParameter, ",...)"))): object 'fit' not found
# Panel 3: Mixture Normal distribution
# library(nor1mix)
obj = norMixEM(x,m=2)
#> Error in norMixEM(x, m = 2): could not find function "norMixEM"
chart.QQPlot(x, main = "Normal Mixture Distribution",
line=c("quartiles"), distribution = 'norMix', distributionParameter='obj',
envelope=0.95)
#> Error in eval(parse(text = paste("q", distribution, sep = ""))): object 'qnorMix' not found
# Panel 4: Symmetric t distribution
library(sn)
#> Error in library(sn): there is no package called ‘sn’
n = length(x)
fit.tSN = st.mple(as.matrix(rep(1,n)),x,symmetr = TRUE)
#> Error in st.mple(as.matrix(rep(1, n)), x, symmetr = TRUE): could not find function "st.mple"
names(fit.tSN$dp) = c("location","scale","dof")
#> Error: object 'fit.tSN' not found
round(fit.tSN$dp,3)
#> Error: object 'fit.tSN' not found
chart.QQPlot(x, main = "MO Symmetric t-Distribution QQPlot",
xlab = "quantilesSymmetricTdistEst",line = c("quartiles"),
envelope = .95, distribution = 't',
distributionParameter='df=fit.tSN$dp[3]',pch = 20)
#> Error in eval(parse(text = paste("\tz <- q.function(P,", distributionParameter, ",...)"))): object 'fit.tSN' not found
# Panel 5: Skewed t distribution
fit.st = st.mple(as.matrix(rep(1,n)),x)
#> Error in st.mple(as.matrix(rep(1, n)), x): could not find function "st.mple"
# fit.st = st.mple(y=x) Produces same result as line above
names(fit.st$dp) = c("location","scale","skew","dof")
#> Error: object 'fit.st' not found
round(fit.st$dp,3)
#> Error: object 'fit.st' not found
chart.QQPlot(x, main = "MO Returns Skewed t-Distribution QQPlot",
xlab = "quantilesSkewedTdistEst",line = c("quartiles"),
envelope = .95, distribution = 'st',
distributionParameter = 'xi = fit.st$dp[1],
omega = fit.st$dp[2],alpha = fit.st$dp[3],
nu=fit.st$dp[4]',
pch = 20)
#> Error in eval(parse(text = paste("q", distribution, sep = ""))): object 'qst' not found
# Panel 6: Stable Parietian
library(fBasics)
#> Error in library(fBasics): there is no package called ‘fBasics’
fit.stable = stableFit(x,doplot=FALSE)
#> Error in stableFit(x, doplot = FALSE): could not find function "stableFit"
chart.QQPlot(x, main = "Stable Paretian Distribution", envelope=0.95,
distribution = 'stable',
distributionParameter = 'alpha = fit(stable.fit)$estimate[[1]],
beta = fit(stable.fit)$estimate[[2]],
gamma = fit(stable.fit)$estimate[[3]],
delta = fit(stable.fit)$estimate[[4]], pm = 0')
#> Error in eval(parse(text = paste("q", distribution, sep = ""))): object 'qstable' not found
# \dontrun{}
#end examples