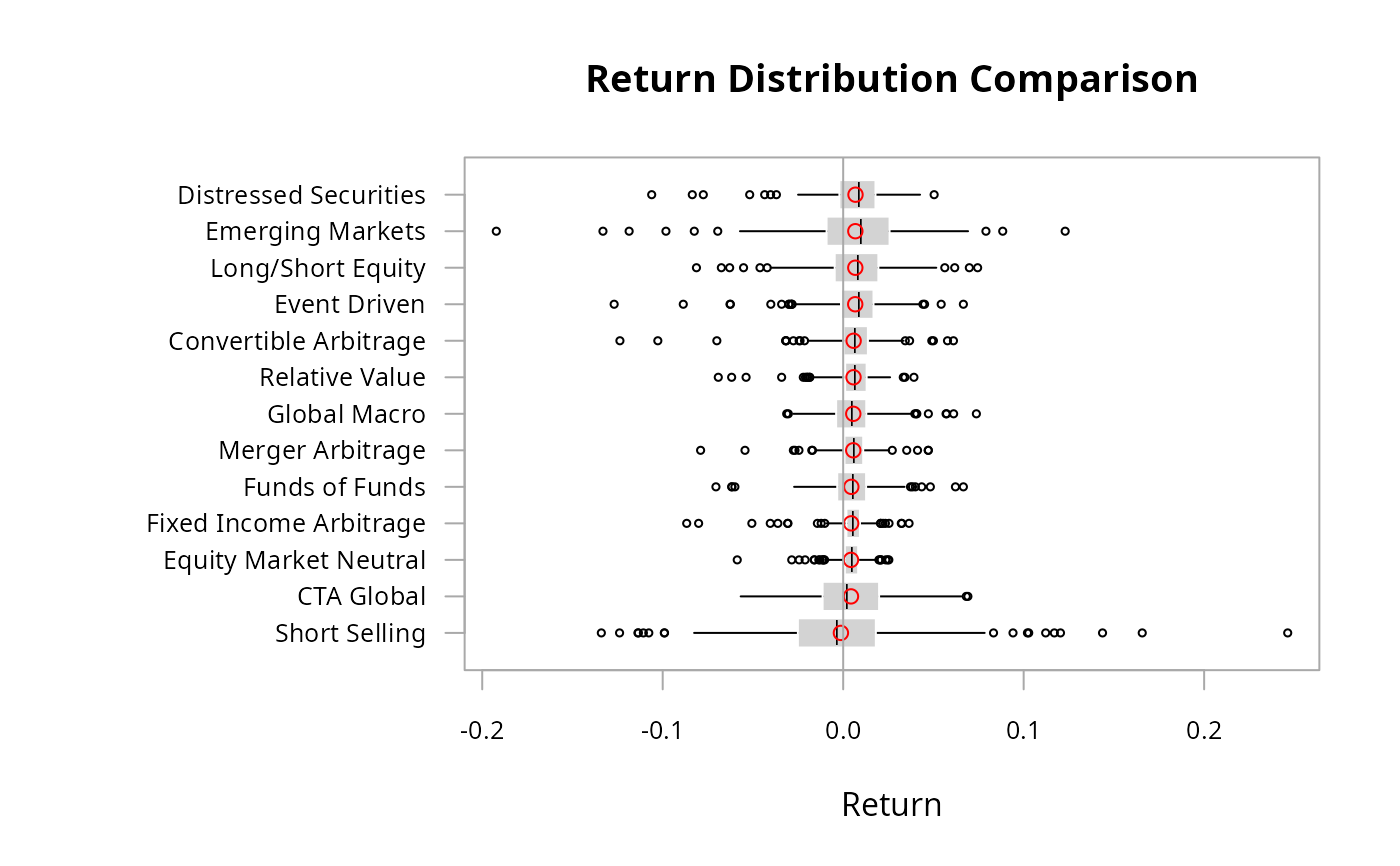
A wrapper to create box and whiskers plot with some defaults useful for comparing distributions.
Usage
chart.Boxplot(
  R,
  names = TRUE,
  as.Tufte = FALSE,
  plot.engine = "default",
  sort.by = c(NULL, "mean", "median", "variance"),
  colorset = "black",
  symbol.color = "red",
  mean.symbol = 1,
  median.symbol = "|",
  outlier.symbol = 1,
  show.data = NULL,
  add.mean = TRUE,
  sort.ascending = FALSE,
  xlab = "Return",
  main = "Return Distribution Comparison",
  element.color = "darkgray",
  ...
)
Arguments
- R
an xts, vector, matrix, data frame, timeSeries or zoo object of asset returns
- names
logical. if TRUE, show the names of each series
- as.Tufte
logical. default FALSE. if TRUE use method derived for Tufte for limiting chartjunk
- plot.engine
choose the plot engine you wish to use: ggplot2, plotly, googlevis and default
- sort.by
one of "NULL", "mean", "median", "variance"
- colorset
color palette to use, set by default to rational choices
- symbol.color
draws the symbols described in
mean.symbol,median.symbol,outlier.symbolin the color specified- mean.symbol
symbol to use for the mean of the distribution
- median.symbol
symbol to use for the median of the distribution
- outlier.symbol
symbol to use for the outliers of the distribution
- show.data
numerical vector of column numbers to display on top of boxplot, default NULL
- add.mean
logical. if TRUE, show a line for the mean of all distributions plotted
- sort.ascending
logical. If TRUE sort the distributions by ascending
sort.by- xlab
set the x-axis label, same as in
plot- main
set the chart title, same as in
plot- element.color
specify the color of chart elements. Default is "darkgray"
- ...
any other passthru parameters
Details
We have also provided controls for all the symbols and lines in the chart.
One default, set by as.Tufte=TRUE, will strip chartjunk and draw a
Boxplot per recommendations by Edward Tufte. It can also be useful when
comparing several series to sort them in order of ascending or descending
"mean", "median", "variance" by use of sort.by and
sort.ascending=TRUE.
References
Tufte, Edward R. The Visual Display of Quantitative Information. Graphics Press. 1983. p. 124-129
Examples
data(edhec)
chart.Boxplot(edhec)
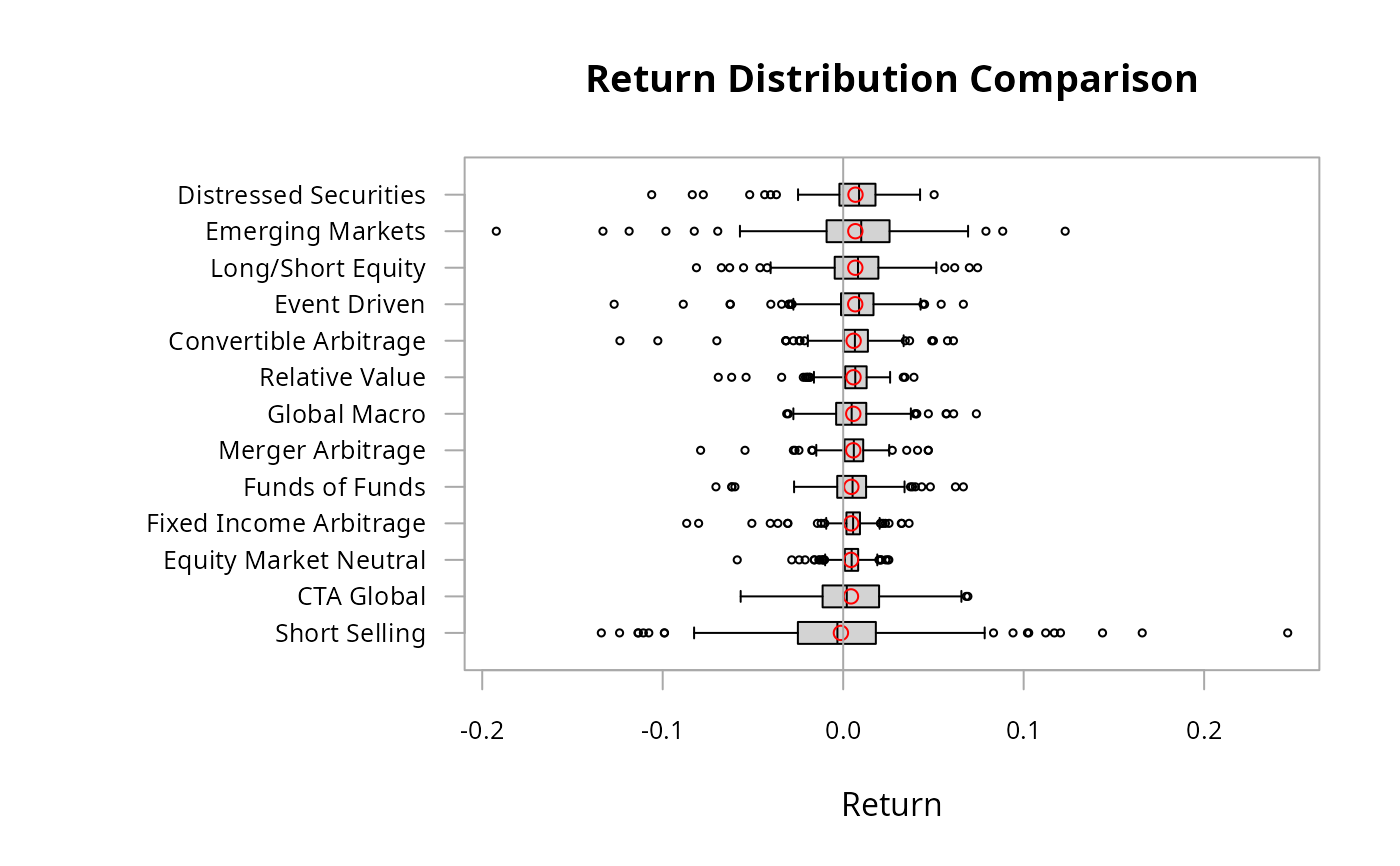 chart.Boxplot(edhec, as.Tufte = TRUE)