Specific risk Summary: Statistics and Stylized Facts
Source:R/table.SpecificRisk.R
table.SpecificRisk.RdTable of specific risk, systematic risk and total risk
table.SpecificRisk(Ra, Rb, Rf = 0, digits = 4)Arguments
References
Carl Bacon, Practical portfolio performance measurement and attribution, second edition 2008 p.76
See also
Examples
data(managers)
table.SpecificRisk(managers[,1:8], managers[,8])
#> HAM1 HAM2 HAM3 HAM4 HAM5 HAM6 EDHEC LS EQ SP500 TR
#> Specific Risk 0.0664 NA 0.0946 0.1521 NA NA NA 0.00
#> Systematic Risk 0.0586 0.0515 0.0836 0.1032 0.0477 0.0486 0.0503 0.15
#> Total Risk 0.0886 NA 0.1262 0.1838 NA NA NA 0.15
# don't test on CRAN, since it requires Suggested packages
require("Hmisc")
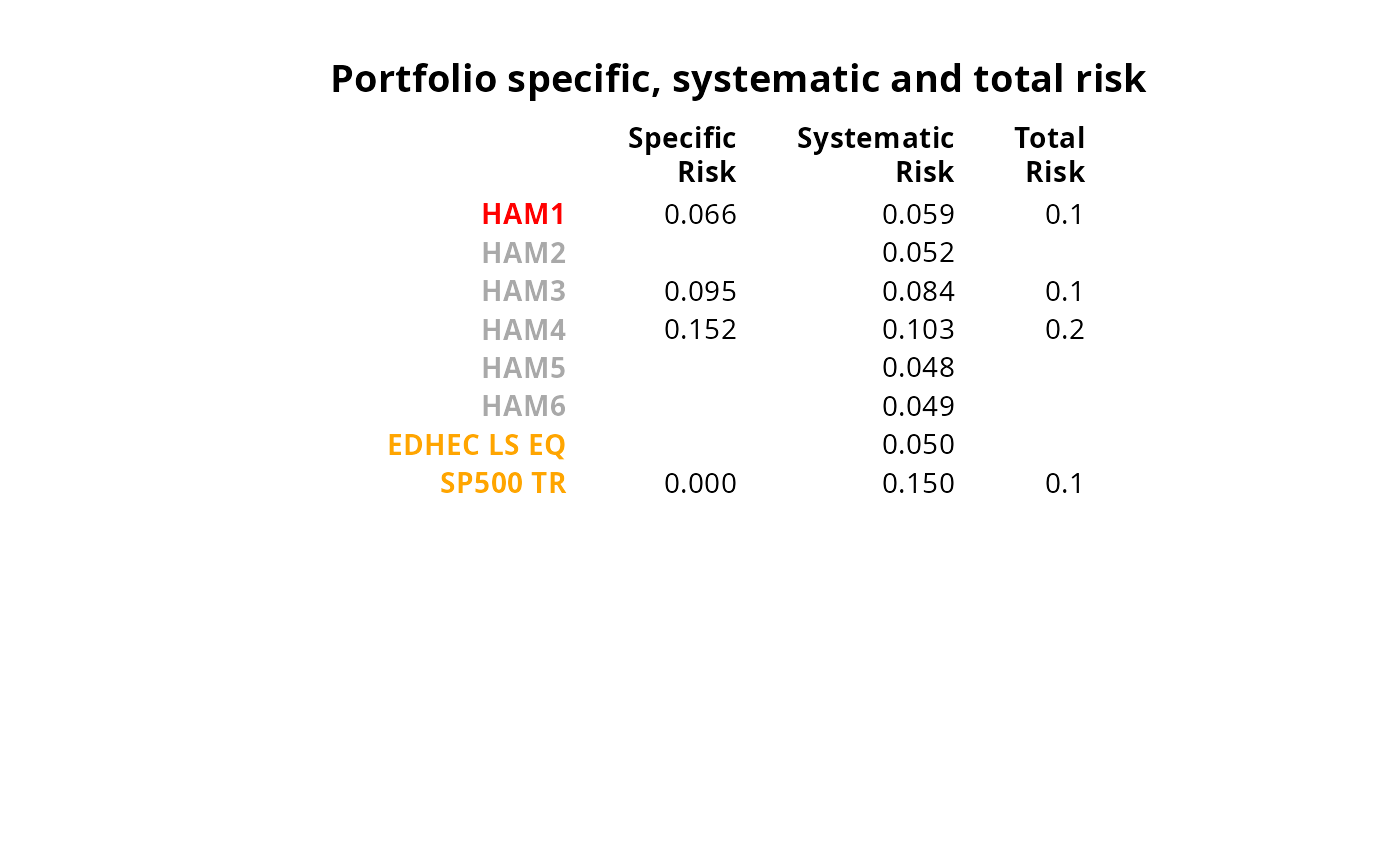
result = t(table.SpecificRisk(managers[,1:8], managers[,8], Rf=.04/12))
textplot(format.df(result, na.blank=TRUE, numeric.dollar=FALSE, cdec=c(3,3,1)),
rmar = 0.8, cmar = 2, max.cex=.9, halign = "center", valign = "top",
row.valign="center", wrap.rownames=20, wrap.colnames=10,
col.rownames=c("red", rep("darkgray",5), rep("orange",2)), mar = c(0,0,3,0)+0.1)
title(main="Portfolio specific, systematic and total risk")