Rolling Periods Summary: Statistics and Stylized Facts
Source:R/table.RollingPeriods.R
table.RollingPeriods.RdA table of estimates of rolling period return measures
table.RollingPeriods(
  R,
  periods = subset(c(12, 36, 60), c(12, 36, 60) < length(as.matrix(R[, 1]))),
  FUNCS = c("mean", "sd"),
  funcs.names = c("Average", "Std Dev"),
  digits = 4,
  ...
)

table.TrailingPeriodsRel(
  R,
  Rb,
  periods = subset(c(12, 36, 60), c(12, 36, 60) < length(as.matrix(R[, 1]))),
  FUNCS = c("cor", "CAPM.beta"),
  funcs.names = c("Correlation", "Beta"),
  digits = 4,
  ...
)
Arguments
- R
an xts, vector, matrix, data frame, timeSeries or zoo object of asset returns
- periods
number of periods to use as rolling window(s), subset of
c(3, 6, 9, 12, 18, 24, 36, 48)- FUNCS
list of functions to apply the rolling period to
- funcs.names
vector of function names used for labeling table rows
- digits
number of digits to round results to
- ...
any other passthru parameters for functions specified in FUNCS
- Rb
an xts, vector, matrix, data frame, timeSeries or zoo object of index, benchmark, portfolio, or secondary asset returns to compare against
See also
Examples
data(edhec)
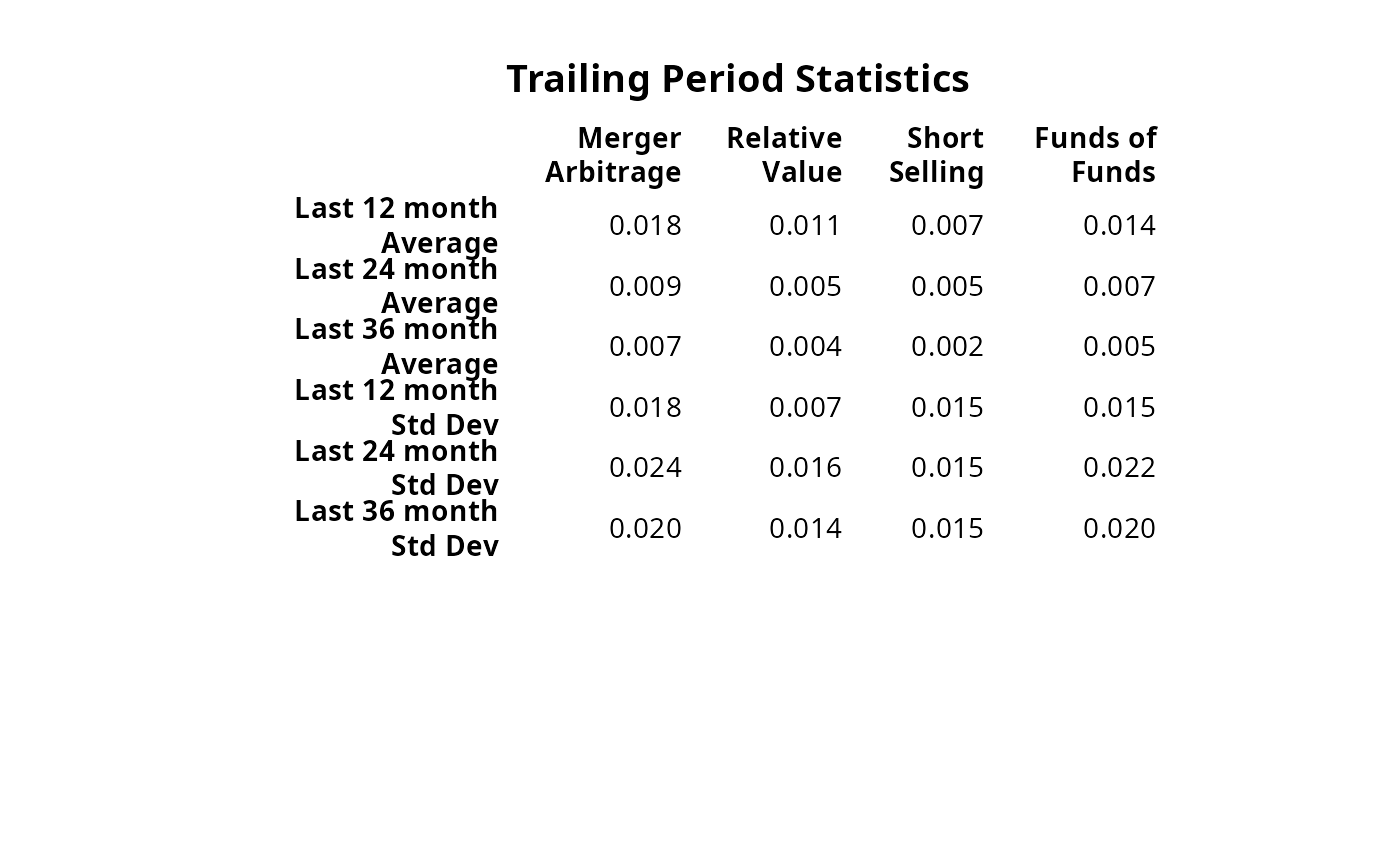
table.TrailingPeriods(edhec[,10:13], periods=c(12,24,36))
#> Merger Arbitrage Relative Value Short Selling
#> Last 12 month Average 0.0175 0.0110 0.0074
#> Last 24 month Average 0.0085 0.0055 0.0055
#> Last 36 month Average 0.0069 0.0039 0.0016
#> Last 12 month Std Dev 0.0181 0.0066 0.0154
#> Last 24 month Std Dev 0.0245 0.0164 0.0147
#> Last 36 month Std Dev 0.0203 0.0141 0.0154
#> Funds of Funds
#> Last 12 month Average 0.0142
#> Last 24 month Average 0.0074
#> Last 36 month Average 0.0046
#> Last 12 month Std Dev 0.0150
#> Last 24 month Std Dev 0.0217
#> Last 36 month Std Dev 0.0195
result=table.TrailingPeriods(edhec[,10:13], periods=c(12,24,36))
# don't test on CRAN, since it requires Suggested packages
require("Hmisc")
textplot(format.df(result, na.blank=TRUE, numeric.dollar=FALSE,
cdec=rep(3,dim(result)[2])), rmar = 0.8, cmar = 1.5,
max.cex=.9, halign = "center", valign = "top", row.valign="center",
wrap.rownames=15, wrap.colnames=10, mar = c(0,0,3,0)+0.1)
title(main="Trailing Period Statistics")