Returns Summary: Statistics and Stylized Facts
Source:R/table.MonthlyReturns.R
table.MonthlyReturns.RdReturns a basic set of statistics that match the period of the data passed in (e.g., monthly returns will get monthly statistics, daily will be daily stats, and so on)
table.Stats(R, ci = 0.95, digits = 4)Arguments
Details
This was created as a way to display a set of related statistics together for comparison across a set of instruments or funds. Careful consideration to missing data or unequal time series should be given when intepreting the results.
Examples
data(edhec)
table.Stats(edhec[,1:3])
#> Convertible Arbitrage CTA Global Distressed Securities
#> Observations 293.0000 293.0000 293.0000
#> NAs 0.0000 0.0000 0.0000
#> Minimum -0.1237 -0.0568 -0.1061
#> Quartile 1 0.0002 -0.0114 -0.0021
#> Median 0.0065 0.0020 0.0088
#> Arithmetic Mean 0.0058 0.0043 0.0068
#> Geometric Mean 0.0056 0.0041 0.0067
#> Quartile 3 0.0137 0.0199 0.0179
#> Maximum 0.0611 0.0691 0.0504
#> SE Mean 0.0010 0.0013 0.0011
#> LCL Mean (0.95) 0.0039 0.0017 0.0047
#> UCL Mean (0.95) 0.0077 0.0069 0.0089
#> Variance 0.0003 0.0005 0.0003
#> Stdev 0.0168 0.0228 0.0181
#> Skewness -2.5970 0.1628 -1.7283
#> Kurtosis 18.6011 -0.0076 7.7946
t(table.Stats(edhec))
#> Observations NAs Minimum Quartile 1 Median
#> Convertible Arbitrage 293 0 -0.1237 0.0002 0.0065
#> CTA Global 293 0 -0.0568 -0.0114 0.0020
#> Distressed Securities 293 0 -0.1061 -0.0021 0.0088
#> Emerging Markets 293 0 -0.1922 -0.0092 0.0100
#> Equity Market Neutral 293 0 -0.0587 0.0009 0.0047
#> Event Driven 293 0 -0.1269 -0.0012 0.0088
#> Fixed Income Arbitrage 293 0 -0.0867 0.0018 0.0055
#> Global Macro 293 0 -0.0313 -0.0039 0.0047
#> Long/Short Equity 293 0 -0.0813 -0.0047 0.0082
#> Merger Arbitrage 293 0 -0.0790 0.0007 0.0059
#> Relative Value 293 0 -0.0692 0.0011 0.0067
#> Short Selling 293 0 -0.1340 -0.0251 -0.0032
#> Funds of Funds 293 0 -0.0705 -0.0033 0.0052
#> Arithmetic Mean Geometric Mean Quartile 3 Maximum
#> Convertible Arbitrage 0.0058 0.0056 0.0137 0.0611
#> CTA Global 0.0043 0.0041 0.0199 0.0691
#> Distressed Securities 0.0068 0.0067 0.0179 0.0504
#> Emerging Markets 0.0067 0.0062 0.0257 0.1230
#> Equity Market Neutral 0.0043 0.0043 0.0083 0.0253
#> Event Driven 0.0067 0.0065 0.0168 0.0666
#> Fixed Income Arbitrage 0.0044 0.0044 0.0093 0.0365
#> Global Macro 0.0056 0.0055 0.0128 0.0738
#> Long/Short Equity 0.0067 0.0065 0.0195 0.0745
#> Merger Arbitrage 0.0056 0.0055 0.0111 0.0472
#> Relative Value 0.0057 0.0057 0.0130 0.0392
#> Short Selling -0.0013 -0.0023 0.0181 0.2463
#> Funds of Funds 0.0045 0.0044 0.0127 0.0666
#> SE Mean LCL Mean (0.95) UCL Mean (0.95) Variance Stdev
#> Convertible Arbitrage 0.0010 0.0039 0.0077 0.0003 0.0168
#> CTA Global 0.0013 0.0017 0.0069 0.0005 0.0228
#> Distressed Securities 0.0011 0.0047 0.0089 0.0003 0.0181
#> Emerging Markets 0.0019 0.0030 0.0105 0.0011 0.0327
#> Equity Market Neutral 0.0005 0.0034 0.0053 0.0001 0.0082
#> Event Driven 0.0011 0.0045 0.0089 0.0004 0.0191
#> Fixed Income Arbitrage 0.0007 0.0031 0.0057 0.0001 0.0115
#> Global Macro 0.0009 0.0039 0.0073 0.0002 0.0146
#> Long/Short Equity 0.0012 0.0043 0.0091 0.0004 0.0209
#> Merger Arbitrage 0.0007 0.0043 0.0069 0.0001 0.0115
#> Relative Value 0.0007 0.0044 0.0071 0.0001 0.0119
#> Short Selling 0.0027 -0.0065 0.0040 0.0021 0.0455
#> Funds of Funds 0.0009 0.0027 0.0064 0.0003 0.0161
#> Skewness Kurtosis
#> Convertible Arbitrage -2.5970 18.6011
#> CTA Global 0.1628 -0.0076
#> Distressed Securities -1.7283 7.7946
#> Emerging Markets -1.2205 6.0126
#> Equity Market Neutral -1.9173 12.4266
#> Event Driven -1.8806 10.2736
#> Fixed Income Arbitrage -3.7918 25.4966
#> Global Macro 0.8826 2.4863
#> Long/Short Equity -0.4702 1.9028
#> Merger Arbitrage -1.6216 12.7706
#> Relative Value -2.0781 10.1597
#> Short Selling 0.7737 3.6282
#> Funds of Funds -0.5969 4.3957
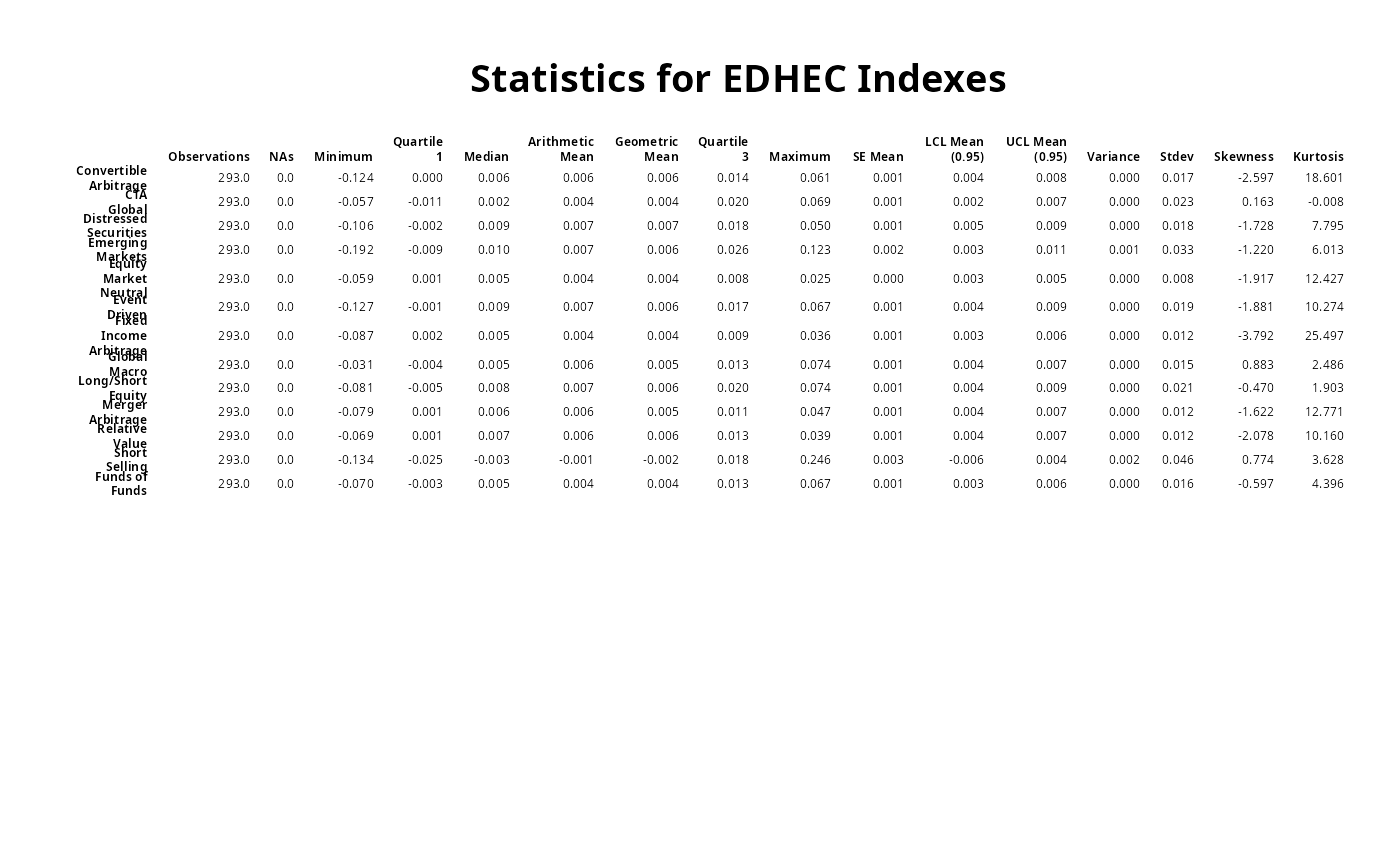
result=t(table.Stats(edhec))
# don't test on CRAN, since it requires Suggested packages
require("Hmisc")
textplot(format.df(result, na.blank=TRUE, numeric.dollar=FALSE, cdec=c(rep(1,2),rep(3,14))),
rmar = 0.8, cmar = 1.5, max.cex=.9, halign = "center", valign = "top",
row.valign="center", wrap.rownames=10, wrap.colnames=10, mar = c(0,0,3,0)+0.1)
title(main="Statistics for EDHEC Indexes")