Information ratio Summary: Statistics and Stylized Facts
Source:R/table.InformationRatio.R
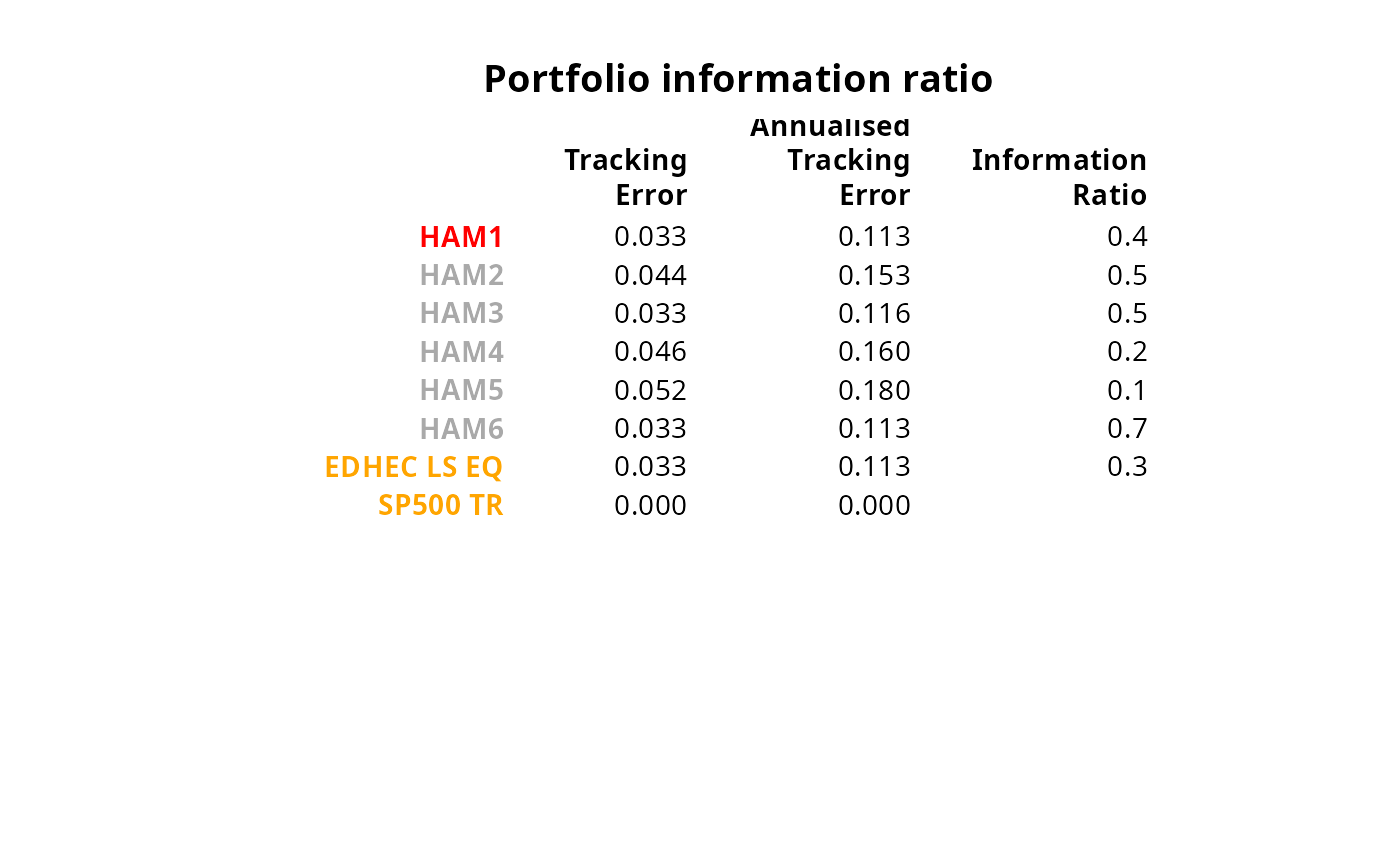
table.InformationRatio.RdTable of Tracking error, Annualised tracking error and Information ratio
table.InformationRatio(R, Rb, scale = NA, digits = 4)Arguments
References
Carl Bacon, Practical portfolio performance measurement and attribution, second edition 2008 p.81
See also
Examples
data(managers)
table.InformationRatio(managers[,1:8], managers[,8])
#>                             HAM1   HAM2   HAM3   HAM4   HAM5   HAM6 EDHEC LS EQ
#> Tracking Error            0.0327 0.0443 0.0334 0.0461 0.0520 0.0326      0.0326
#> Annualised Tracking Error 0.1132 0.1534 0.1159 0.1597 0.1800 0.1128      0.1130
#> Information Ratio         0.3604 0.5060 0.4701 0.1549 0.1212 0.6723      0.2985
#>                           SP500 TR
#> Tracking Error                   0
#> Annualised Tracking Error        0
#> Information Ratio              NaN

 # don't test on CRAN, since it requires Suggested packages

require("Hmisc")
result = t(table.InformationRatio(managers[,1:8], managers[,8]))

textplot(format.df(result, na.blank=TRUE, numeric.dollar=FALSE, cdec=c(3,3,1)),
rmar = 0.8, cmar = 2,  max.cex=.9, halign = "center", valign = "top",
row.valign="center", wrap.rownames=20, wrap.colnames=10,
col.rownames=c("red", rep("darkgray",5), rep("orange",2)), mar = c(0,0,3,0)+0.1)
title(main="Portfolio information ratio")