Table of Calmar ratio, Sterling ratio, Burke ratio, Pain index, Ulcer index, Pain ratio and Martin ratio
table.DrawdownsRatio(R, Rf = 0, scale = NA, digits = 4)Arguments
References
Carl Bacon, Practical portfolio performance measurement and attribution, second edition 2008 p.93
Examples
data(managers)
table.DrawdownsRatio(managers[,1:8])
#> HAM1 HAM2 HAM3 HAM4 HAM5 HAM6 EDHEC LS EQ SP500 TR
#> Sterling ratio 0.5463 0.5139 0.3884 0.3136 0.0847 0.7678 0.5688 0.1768
#> Calmar ratio 0.9062 0.7281 0.5226 0.4227 0.1096 1.7425 1.0982 0.2163
#> Burke ratio 0.6593 0.8970 0.6079 0.1998 0.1008 1.0788 0.8452 0.2191
#> Pain index 0.0157 0.0642 0.0674 0.0739 0.1452 0.0183 0.0178 0.1226
#> Ulcer index 0.0362 0.1000 0.1114 0.1125 0.1828 0.0299 0.0325 0.1893
#> Pain ratio 8.7789 2.7187 2.2438 1.6443 0.2570 7.4837 6.6466 0.7891
#> Martin ratio 3.7992 1.7473 1.3572 1.0798 0.2042 4.5928 3.6345 0.5112
# don't test on CRAN, since it requires Suggested packages
require("Hmisc")
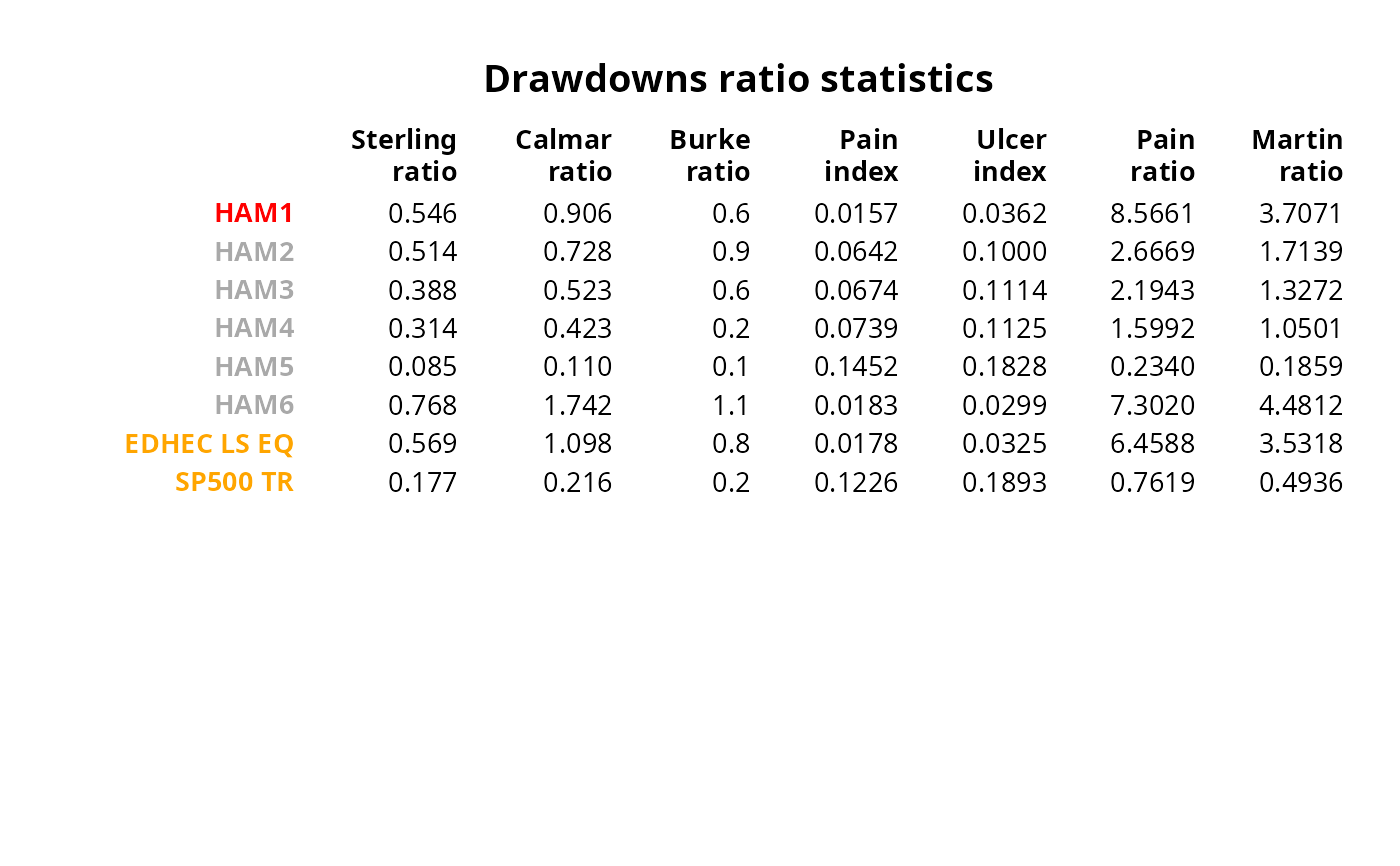
result = t(table.DrawdownsRatio(managers[,1:8], Rf=.04/12))
textplot(format.df(result, na.blank=TRUE, numeric.dollar=FALSE, cdec=c(3,3,1)),
rmar = 0.8, cmar = 2, max.cex=.9, halign = "center", valign = "top",
row.valign="center", wrap.rownames=20, wrap.colnames=10,
col.rownames=c("red", rep("darkgray",5), rep("orange",2)), mar = c(0,0,3,0)+0.1)
title(main="Drawdowns ratio statistics")