Downside Risk Summary: Statistics and Stylized Facts
Source:R/table.DownsideRisk.R
table.DownsideRisk.RdCreates a table of estimates of downside risk measures for comparison across multiple instruments or funds.
table.DownsideRisk(
  R,
  ci = 0.95,
  scale = NA,
  Rf = 0,
  MAR = 0.1/12,
  p = 0.95,
  digits = 4
)
Arguments
- R
an xts, vector, matrix, data frame, timeSeries or zoo object of asset returns
- ci
confidence interval, defaults to 95%
- scale
number of periods in a year (daily scale = 252, monthly scale = 12, quarterly scale = 4)
- Rf
risk free rate, in same period as your returns
- MAR
Minimum Acceptable Return, in the same periodicity as your returns
- p
confidence level for calculation, default p=.99
- digits
number of digits to round results to
See also
Examples
data(edhec)
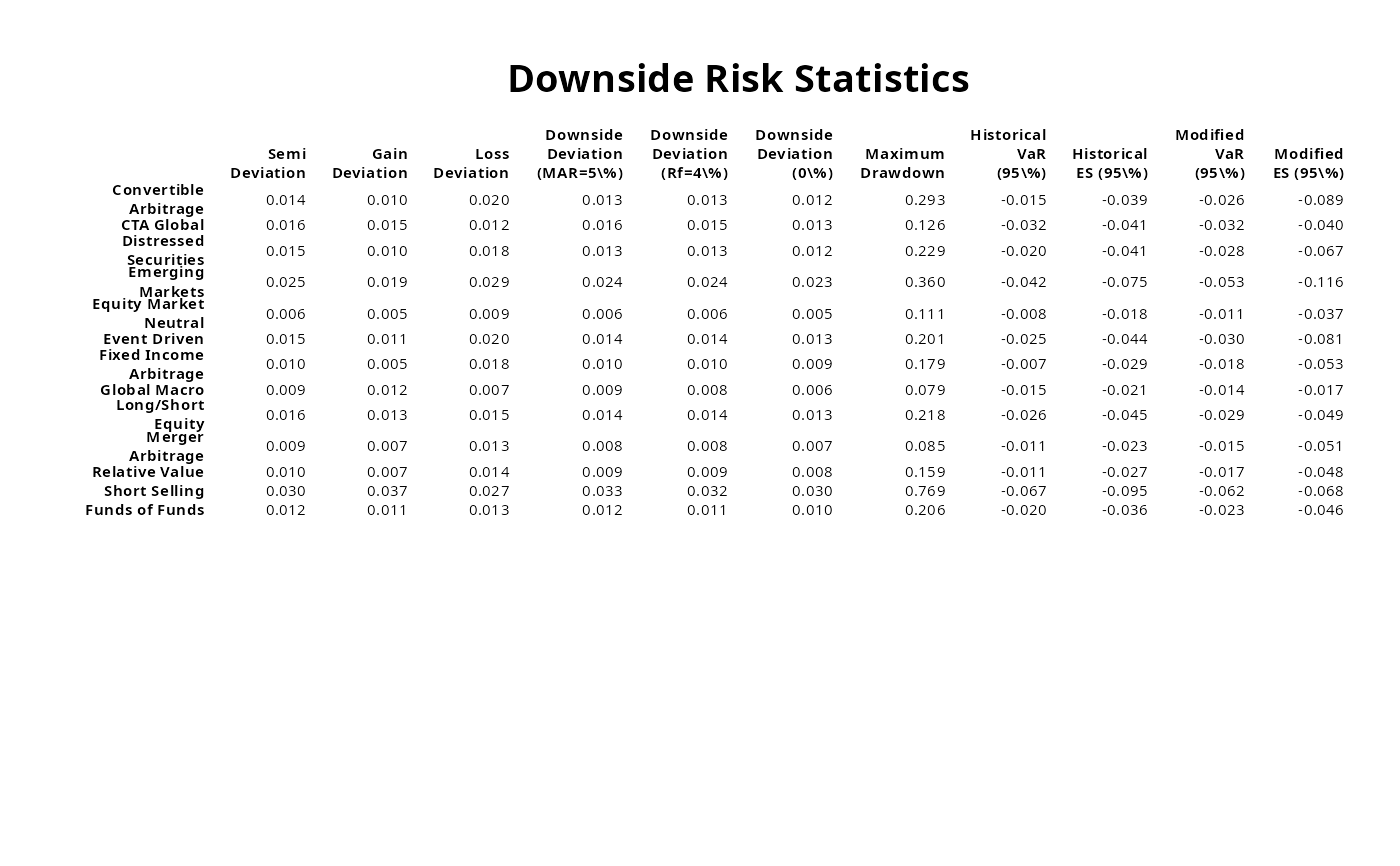
table.DownsideRisk(edhec, Rf=.04/12, MAR =.05/12, p=.95)
#> Convertible Arbitrage CTA Global
#> Semi Deviation 0.0136 0.0156
#> Gain Deviation 0.0095 0.0153
#> Loss Deviation 0.0203 0.0123
#> Downside Deviation (MAR=5%) 0.0131 0.0156
#> Downside Deviation (Rf=4%) 0.0128 0.0151
#> Downside Deviation (0%) 0.0118 0.0132
#> Maximum Drawdown 0.2927 0.1256
#> Historical VaR (95%) -0.0151 -0.0315
#> Historical ES (95%) -0.0388 -0.0406
#> Modified VaR (95%) -0.0257 -0.0320
#> Modified ES (95%) -0.0894 -0.0404
#> Distressed Securities Emerging Markets
#> Semi Deviation 0.0146 0.0255
#> Gain Deviation 0.0099 0.0186
#> Loss Deviation 0.0177 0.0287
#> Downside Deviation (MAR=5%) 0.0134 0.0244
#> Downside Deviation (Rf=4%) 0.0131 0.0240
#> Downside Deviation (0%) 0.0119 0.0226
#> Maximum Drawdown 0.2292 0.3598
#> Historical VaR (95%) -0.0198 -0.0423
#> Historical ES (95%) -0.0413 -0.0754
#> Modified VaR (95%) -0.0280 -0.0534
#> Modified ES (95%) -0.0673 -0.1157
#> Equity Market Neutral Event Driven
#> Semi Deviation 0.0065 0.0154
#> Gain Deviation 0.0051 0.0106
#> Loss Deviation 0.0093 0.0198
#> Downside Deviation (MAR=5%) 0.0064 0.0143
#> Downside Deviation (Rf=4%) 0.0061 0.0140
#> Downside Deviation (0%) 0.0050 0.0129
#> Maximum Drawdown 0.1108 0.2008
#> Historical VaR (95%) -0.0084 -0.0255
#> Historical ES (95%) -0.0175 -0.0445
#> Modified VaR (95%) -0.0110 -0.0296
#> Modified ES (95%) -0.0367 -0.0811
#> Fixed Income Arbitrage Global Macro
#> Semi Deviation 0.0099 0.0093
#> Gain Deviation 0.0055 0.0119
#> Loss Deviation 0.0179 0.0067
#> Downside Deviation (MAR=5%) 0.0098 0.0085
#> Downside Deviation (Rf=4%) 0.0096 0.0080
#> Downside Deviation (0%) 0.0088 0.0063
#> Maximum Drawdown 0.1788 0.0792
#> Historical VaR (95%) -0.0072 -0.0149
#> Historical ES (95%) -0.0291 -0.0211
#> Modified VaR (95%) -0.0177 -0.0138
#> Modified ES (95%) -0.0531 -0.0170
#> Long/Short Equity Merger Arbitrage Relative Value
#> Semi Deviation 0.0155 0.0089 0.0097
#> Gain Deviation 0.0132 0.0073 0.0066
#> Loss Deviation 0.0154 0.0125 0.0137
#> Downside Deviation (MAR=5%) 0.0143 0.0084 0.0091
#> Downside Deviation (Rf=4%) 0.0139 0.0081 0.0088
#> Downside Deviation (0%) 0.0125 0.0070 0.0078
#> Maximum Drawdown 0.2182 0.0850 0.1594
#> Historical VaR (95%) -0.0262 -0.0107 -0.0114
#> Historical ES (95%) -0.0448 -0.0233 -0.0271
#> Modified VaR (95%) -0.0295 -0.0150 -0.0174
#> Modified ES (95%) -0.0486 -0.0513 -0.0475
#> Short Selling Funds of Funds
#> Semi Deviation 0.0296 0.0120
#> Gain Deviation 0.0372 0.0105
#> Loss Deviation 0.0271 0.0132
#> Downside Deviation (MAR=5%) 0.0326 0.0118
#> Downside Deviation (Rf=4%) 0.0322 0.0114
#> Downside Deviation (0%) 0.0303 0.0101
#> Maximum Drawdown 0.7687 0.2059
#> Historical VaR (95%) -0.0668 -0.0203
#> Historical ES (95%) -0.0948 -0.0357
#> Modified VaR (95%) -0.0622 -0.0231
#> Modified ES (95%) -0.0675 -0.0459
result=t(table.DownsideRisk(edhec, Rf=.04/12, MAR =.05/12, p=.95))
# don't test on CRAN, since it requires Suggested packages
require("Hmisc")
textplot(format.df(result, na.blank=TRUE, numeric.dollar=FALSE,
cdec=rep(3,dim(result)[2])), rmar = 0.8, cmar = 1.5,
max.cex=.9, halign = "center", valign = "top", row.valign="center",
wrap.rownames=15, wrap.colnames=10, mar = c(0,0,3,0)+0.1)
title(main="Downside Risk Statistics")