This is a wrapper for calculating correlation and significance against each column of the data provided.
table.Correlation(Ra, Rb, ...)Arguments
- Ra
a vector of returns to test, e.g., the asset to be examined
- Rb
a matrix, data.frame, or timeSeries of benchmark(s) to test the asset against.
- ...
any other passthru parameters to
cor.test
See also
Examples
# First we load the data
data(managers)
table.Correlation(managers[,1:6],managers[,7:8])
#> Correlation p-value Lower CI Upper CI
#> HAM1 to EDHEC LS EQ 0.5896798 1.378595e-12 0.45894685 0.6954188
#> HAM1 to SP500 TR 0.6600671 7.397842e-18 0.55138376 0.7467191
#> HAM2 to EDHEC LS EQ 0.7015847 4.468363e-19 0.59747795 0.7824328
#> HAM2 to SP500 TR 0.4128282 1.715350e-06 0.25576240 0.5486602
#> HAM3 to EDHEC LS EQ 0.8053564 1.443898e-28 0.73174468 0.8603967
#> HAM3 to SP500 TR 0.6608633 6.545409e-18 0.55236590 0.7473433
#> HAM4 to EDHEC LS EQ 0.6148700 7.970417e-14 0.48958597 0.7152802
#> HAM4 to SP500 TR 0.5601846 2.870109e-12 0.43052170 0.6671932
#> HAM5 to EDHEC LS EQ 0.4462382 4.749637e-05 0.24694054 0.6093171
#> HAM5 to SP500 TR 0.2844487 1.216830e-02 0.06458459 0.4779755
#> HAM6 to EDHEC LS EQ 0.7285463 8.879813e-12 0.58804644 0.8263670
#> HAM6 to SP500 TR 0.5091542 1.735968e-05 0.30101889 0.6709863
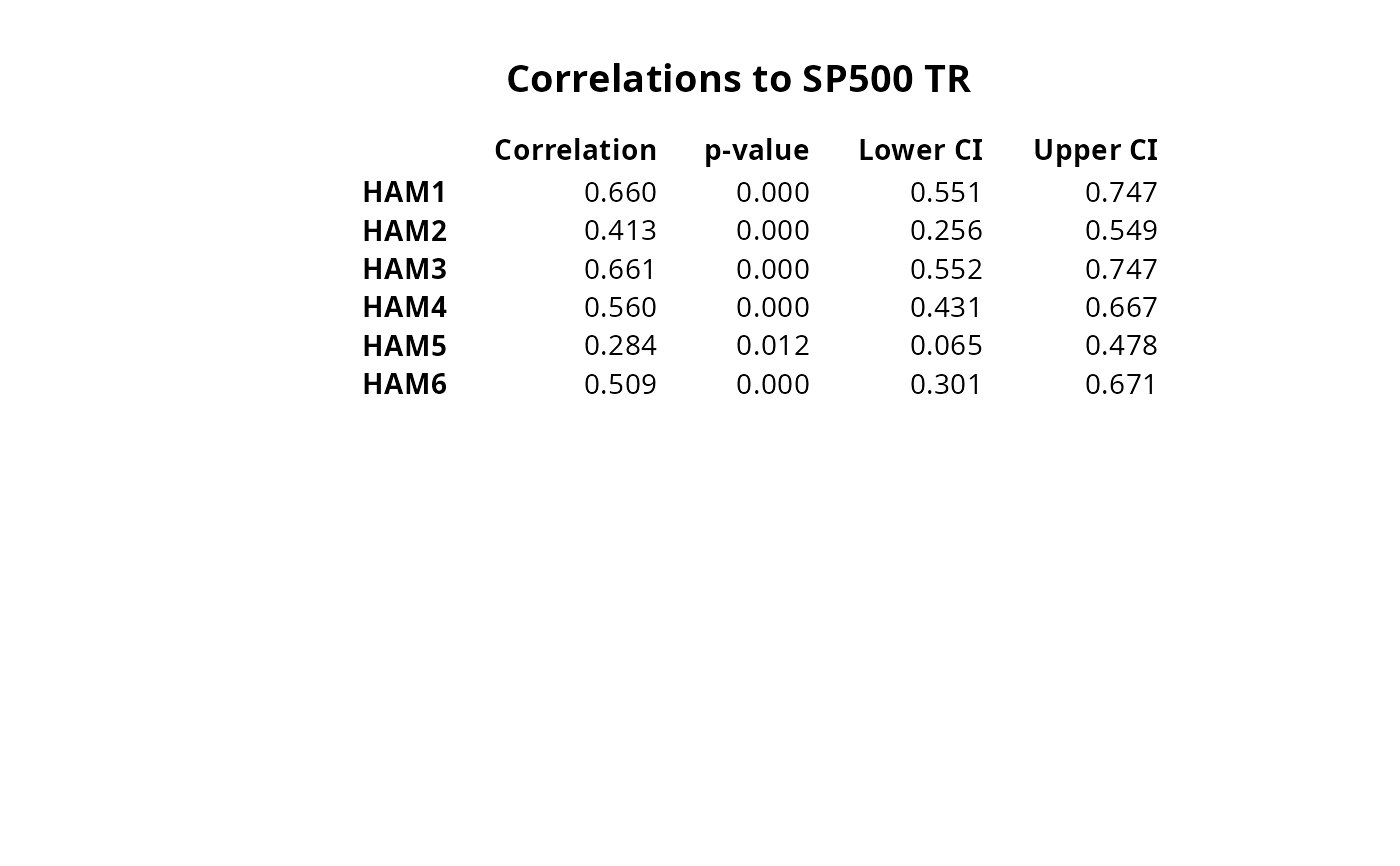
result=table.Correlation(managers[,1:6],managers[,8])
rownames(result)=colnames(managers[,1:6])
# don't test on CRAN, since it requires Suggested packages
require("Hmisc")
textplot(format.df(result, na.blank=TRUE, numeric.dollar=FALSE,
cdec=rep(3,dim(result)[2])), rmar = 0.8, cmar = 1.5,
max.cex=.9, halign = "center", valign = "top", row.valign="center"
, wrap.rownames=20, wrap.colnames=10, mar = c(0,0,3,0)+0.1)
title(main="Correlations to SP500 TR")
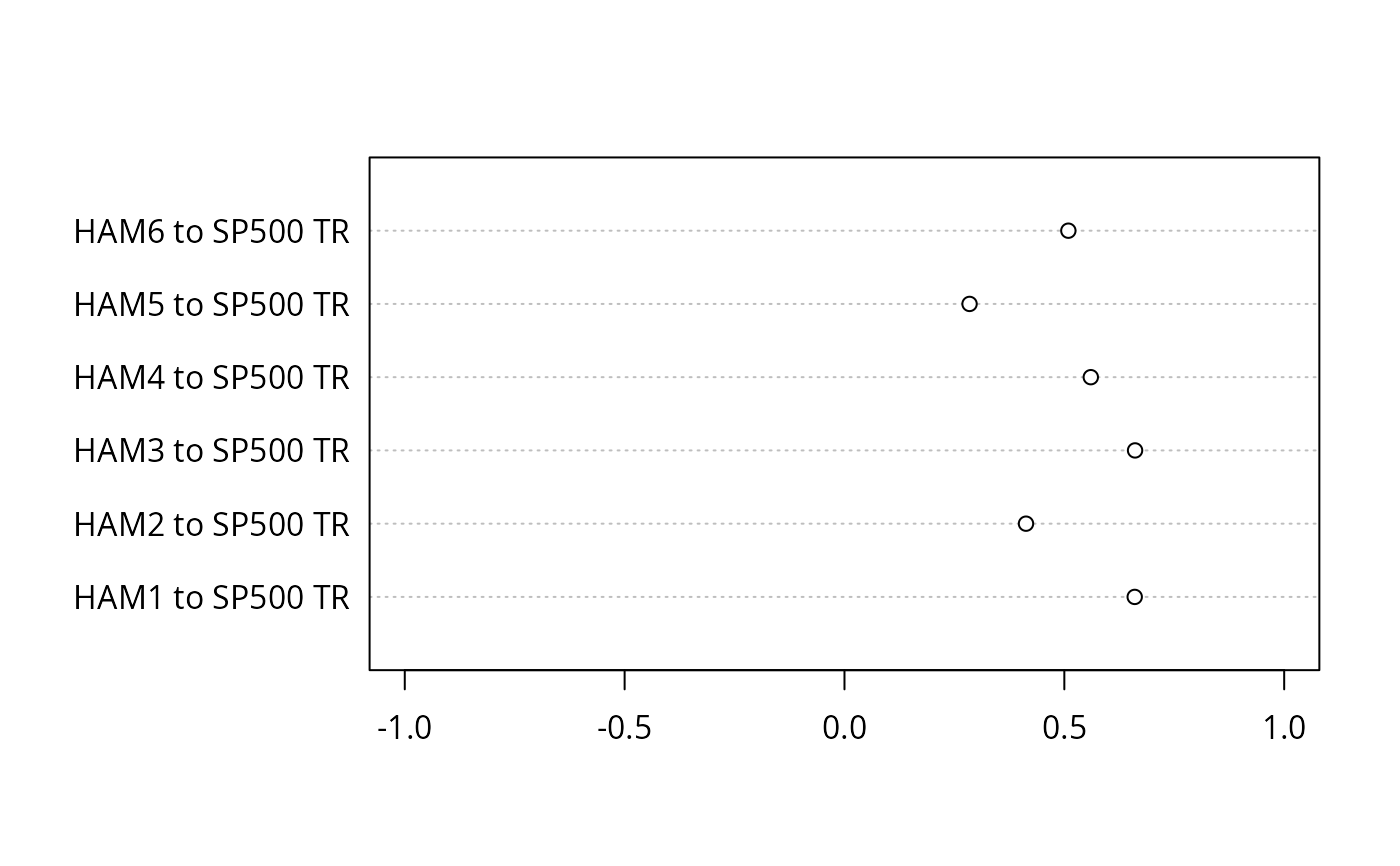
 ctable = table.Correlation(managers[,1:6],managers[,8,drop=FALSE], conf.level=.99)
dotchart(ctable[,1],labels=rownames(ctable),xlim=c(-1,1))
ctable = table.Correlation(managers[,1:6],managers[,8,drop=FALSE], conf.level=.99)
dotchart(ctable[,1],labels=rownames(ctable),xlim=c(-1,1))