Measurements of the relative kidney function (=renal function) for 111
patients. The percentage of the total renal function present in the left
kidney is determined by one reference method, DMSA (static) and by
one of two dynamic methods, DTPA or EC.
Format
A data frame with 222 observations on the following 5 variables:
methMeasurement method, a factor with levels
DMSA,DTPA,EC.itemPatient identification.
yPercentage of total kidney function in the left kidney.
ageAge of the patient.
sexSex of the patient, a factor with levels
F,M.
Source
F. C. Domingues, G. Y. Fujikawa, H. Decker, G. Alonso, J. C. Pereira, P. S. Duarte: Comparison of Relative Renal Function Measured with Either 99mTc-DTPA or 99mTc-EC Dynamic Scintigraphies with that Measured with 99mTc-DMSA Static Scintigraphy. International Braz J Urol Vol. 32 (4): 405-409, 2006
Examples
data(scint)
str(scint)
#> 'data.frame': 222 obs. of 5 variables:
#> $ meth: Factor w/ 3 levels "DMSA","DTPA",..: 2 2 2 2 2 2 2 2 2 2 ...
#> $ item: int 1 2 3 4 5 6 7 8 9 10 ...
#> $ y : int 31 48 49 27 54 51 48 53 63 88 ...
#> $ age : num 15 65 0.33 53 59 0.5 3.25 5 19 61 ...
#> $ sex : Factor w/ 2 levels "F","M": 2 2 2 1 1 2 1 2 2 1 ...
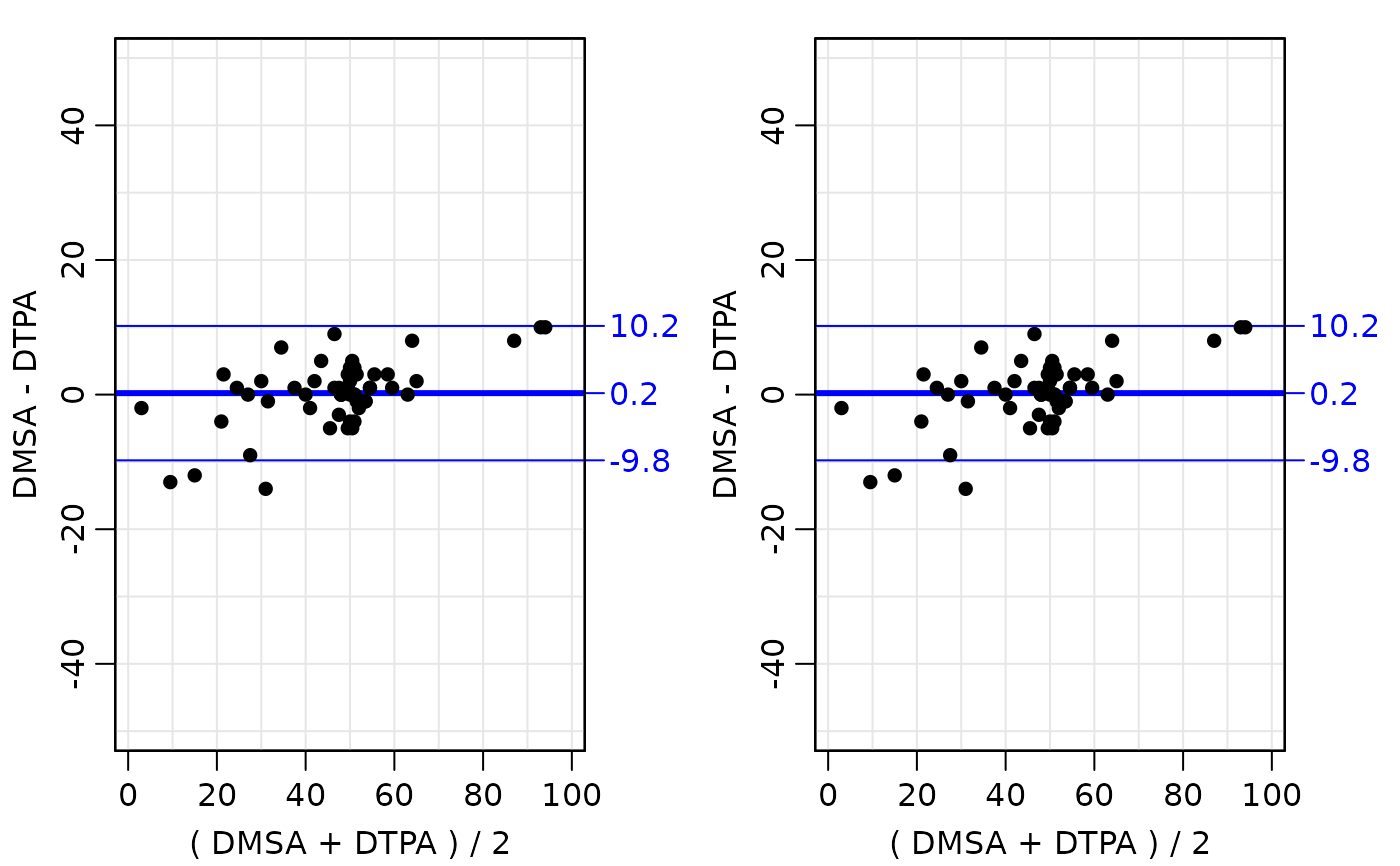
# Make a Bland-Altman plot for each of the possible comparisons:
par(mfrow=c(1,2),mgp=c(3,1,0)/1.6,mar=c(3,3,1,3))
BA.plot(scint,comp.levels=c(1,2),ymax=15,digits=1,cex=2)
#> Warning: "comp.levels" is not a graphical parameter
#> Warning: "ymax" is not a graphical parameter
#> Warning: "comp.levels" is not a graphical parameter
#> Warning: "ymax" is not a graphical parameter
#> Warning: "comp.levels" is not a graphical parameter
#> Warning: "ymax" is not a graphical parameter
#> Warning: "comp.levels" is not a graphical parameter
#> Warning: "ymax" is not a graphical parameter
#> Warning: "comp.levels" is not a graphical parameter
#> Warning: "ymax" is not a graphical parameter
#> Warning: "comp.levels" is not a graphical parameter
#> Warning: "ymax" is not a graphical parameter
#> Warning: "comp.levels" is not a graphical parameter
#> Warning: "ymax" is not a graphical parameter
BA.plot(scint,comp.levels=c(1,3),ymax=15,digits=1,cex=2)
#> Warning: "comp.levels" is not a graphical parameter
#> Warning: "ymax" is not a graphical parameter
#> Warning: "comp.levels" is not a graphical parameter
#> Warning: "ymax" is not a graphical parameter
#> Warning: "comp.levels" is not a graphical parameter
#> Warning: "ymax" is not a graphical parameter
#> Warning: "comp.levels" is not a graphical parameter
#> Warning: "ymax" is not a graphical parameter
#> Warning: "comp.levels" is not a graphical parameter
#> Warning: "ymax" is not a graphical parameter
#> Warning: "comp.levels" is not a graphical parameter
#> Warning: "ymax" is not a graphical parameter
#> Warning: "comp.levels" is not a graphical parameter
#> Warning: "ymax" is not a graphical parameter