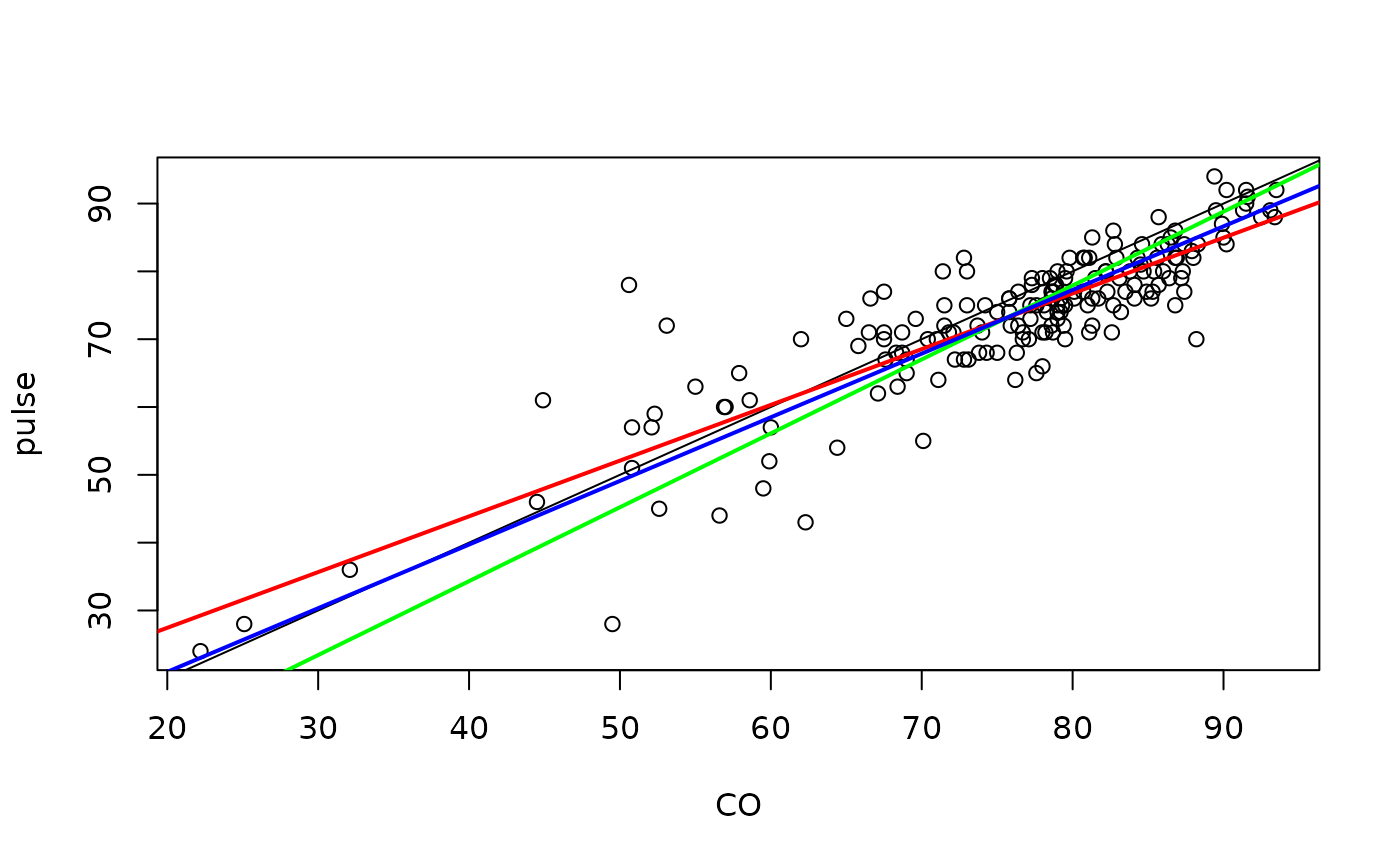
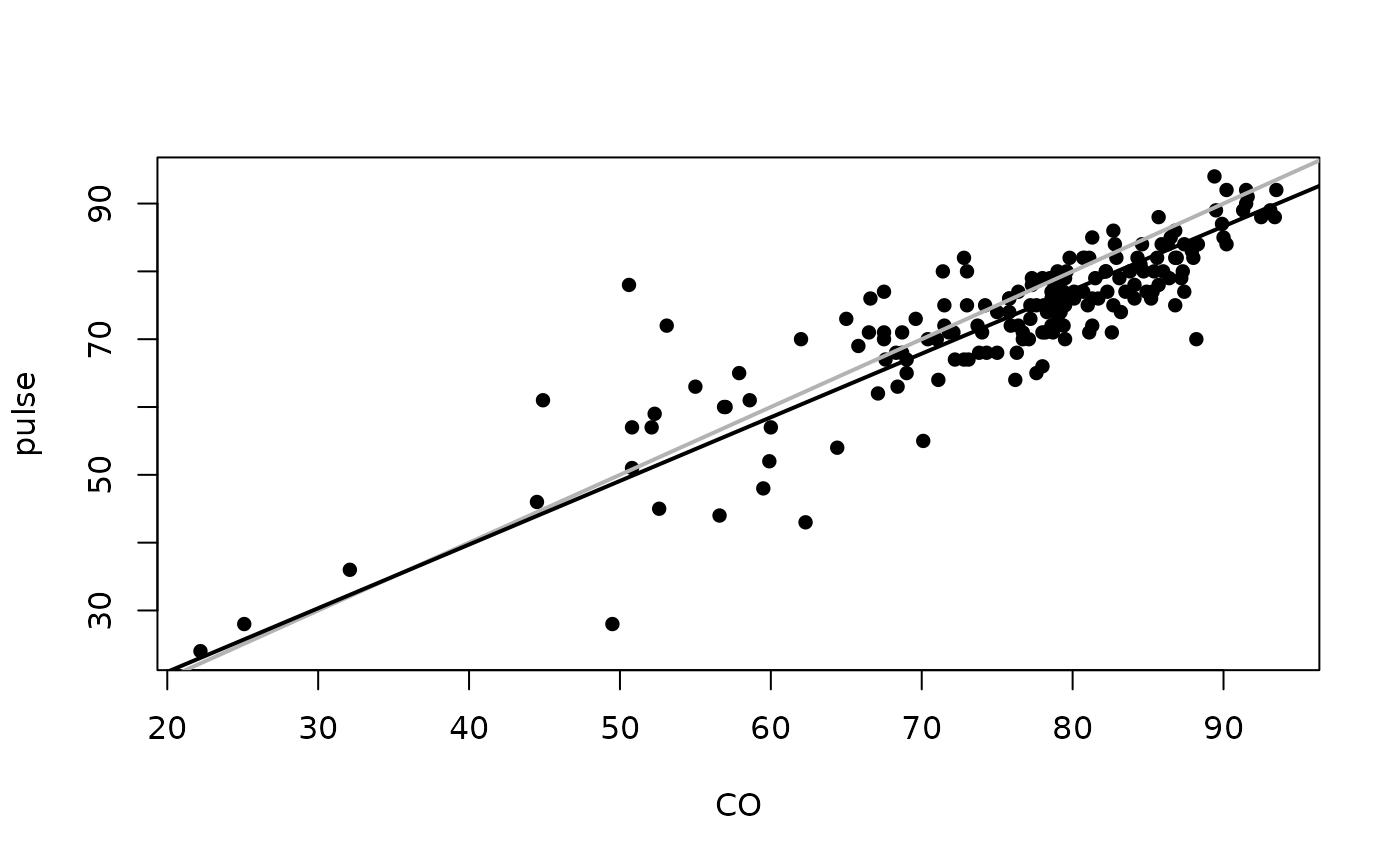
Add the regression lines of \(y\) on \(x\) AND \(x\) on \(y\) to the plot. Optionally add the line obtained by allowing errors in both variables (Deming regression).
bothlines(x, y, Dem = FALSE, sdr = 1, col = "black", ...)Arguments
- x
Numeric vector
- y
Numeric vector
- Dem
Logical. Should the Deming regression line be added too?
- sdr
Numeric. The assumed ratio of standard deviations used in the Deming regression.
- col
Colour of the lines. Can be a vector of up to 3 elements, one for each line.
- ...
Additional arguments passed on to
abline, which does the actual plotting.
Value
None.