Plot Multiple Lines
multLines.RdPlots multiple lines based on a vector x and a matrix y,
draws thin vertical lines connecting limits represented by columns of
y beyond the first. It is assumed that either (1) the second
and third columns of y represent lower and upper confidence
limits, or that (2) there is an even number of columns beyond the
first and these represent ascending quantiles that are symmetrically
arranged around 0.5. If options(grType='plotly') is in effect,
uses plotly graphics instead of grid or base graphics.
For plotly you may want to set the list of possible colors,
etc. using pobj=plot_ly(colors=...). lwd,lty,lwd.vert
are ignored under plotly.
Arguments
- x
a numeric vector
- y
a numeric matrix with number of rows equal to the number of
xelements- pos
when
pos='left'the vertical lines are drawn, right to left, to the left of the point(x, y[,1). Otherwise lines are drawn left to right to the right of the point.- col
a color used to connect
(x, y[,1])pairs. The same color but with transparency given by thealphaargument is used to draw the vertical lines- lwd
line width for main lines
- lty
line types for main lines
- lwd.vert
line width for vertical lines
- lty.vert
line type for vertical lines
- alpha
transparency
- grid
set to
TRUEwhen usinggrid/lattice- pobj
an already started
plotlyobject to add to- xlim
global x-axis limits (required if using
plotly)- name
trace name if using
plotly- legendgroup
legend group name if using
plotly- showlegend
whether or not to show traces in legend, if using
plotly- ...
passed to
add_linesoradd_segmentsif usingplotly
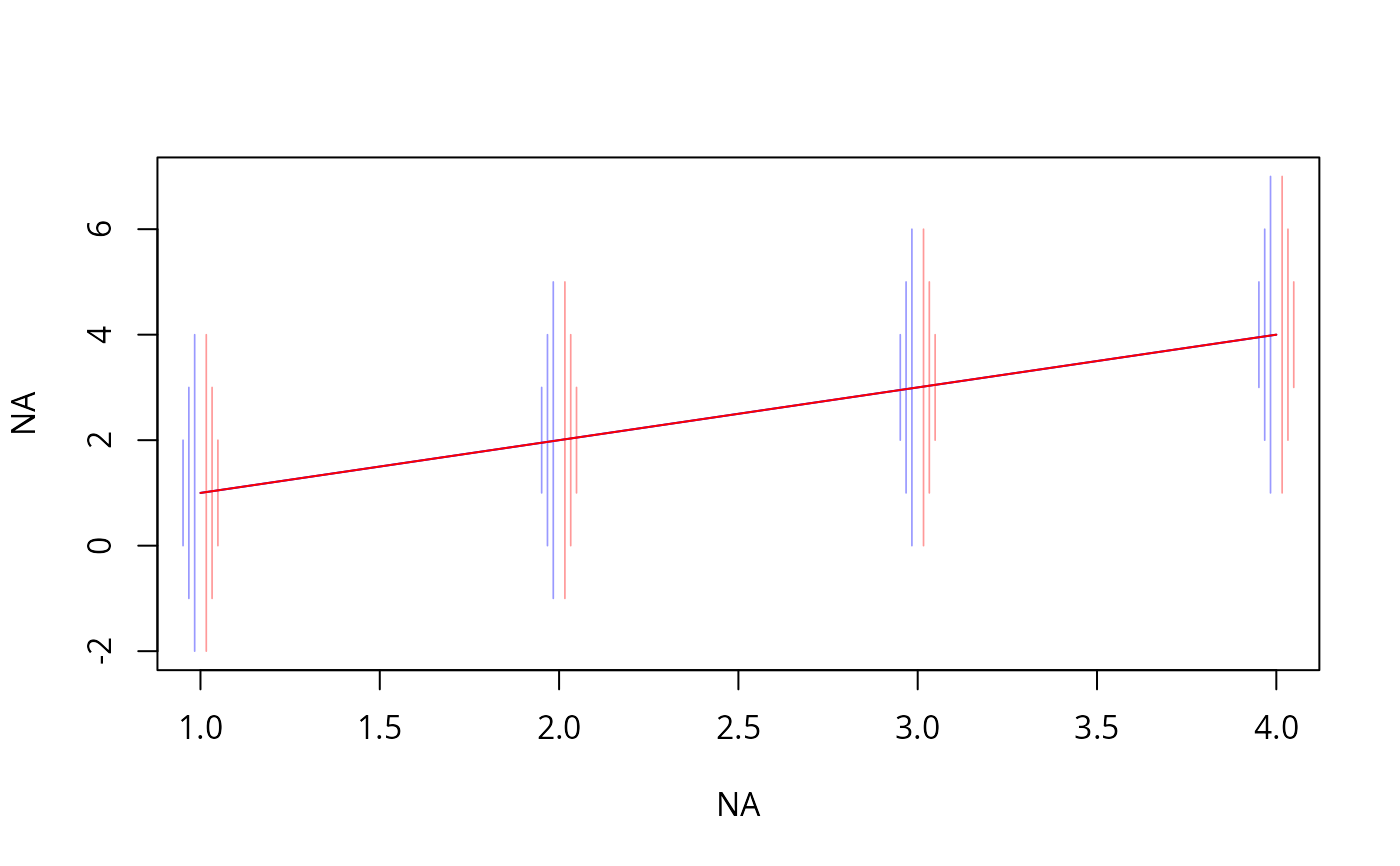
Examples
if (requireNamespace("plotly")) {
  x <- 1:4
  y <- cbind(x, x-3, x-2, x-1, x+1, x+2, x+3)
  plot(NA, NA, xlim=c(1,4), ylim=c(-2, 7))
  multLines(x, y, col='blue')
  multLines(x, y, col='red', pos='right')
}