Minor Tick Marks
minor.tick.RdAdds minor tick marks to an existing plot. All minor tick marks that will fit on the axes will be drawn.
Arguments
- nx
number of intervals in which to divide the area between major tick marks on the X-axis. Set to 1 to suppress minor tick marks.
- ny
same as
nxbut for the Y-axis.- tick.ratio
ratio of lengths of minor tick marks to major tick marks. The length of major tick marks is retrieved from
par("tck").- x.args
additionl arguments (e.g.
post,lwd) used byaxis()function when rendering the X-axis.- y.args
same as
x.argsbut for Y-axis.
Author
Frank Harrell
Department of Biostatistics
Vanderbilt University
fh@fharrell.com
Earl Bellinger
Max Planck Institute
earlbellinger@gmail.com
Viktor Horvath
Brandeis University
vhorvath@brandeis.edu
Examples
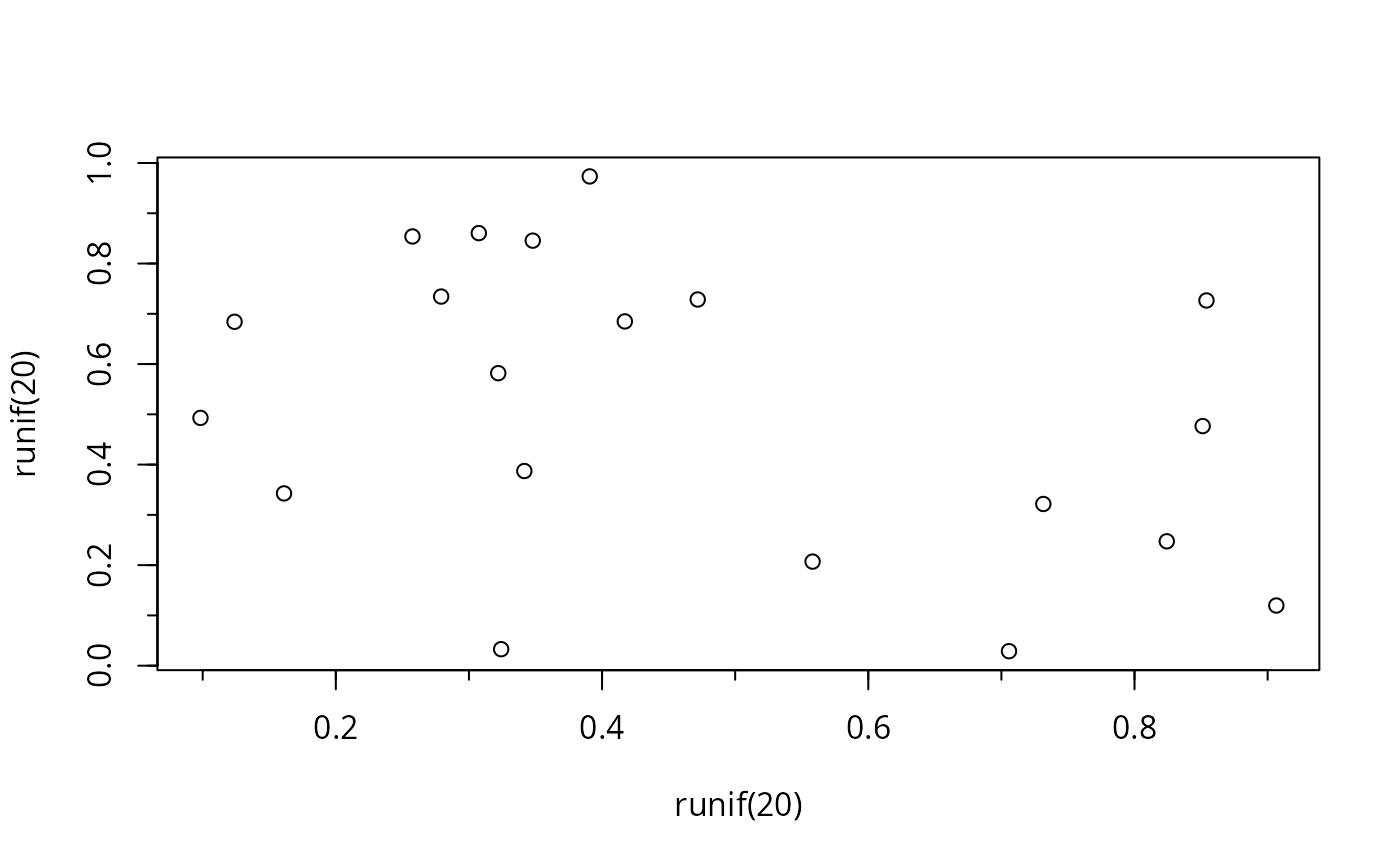
# Plot with default settings
plot(runif(20), runif(20))
minor.tick()
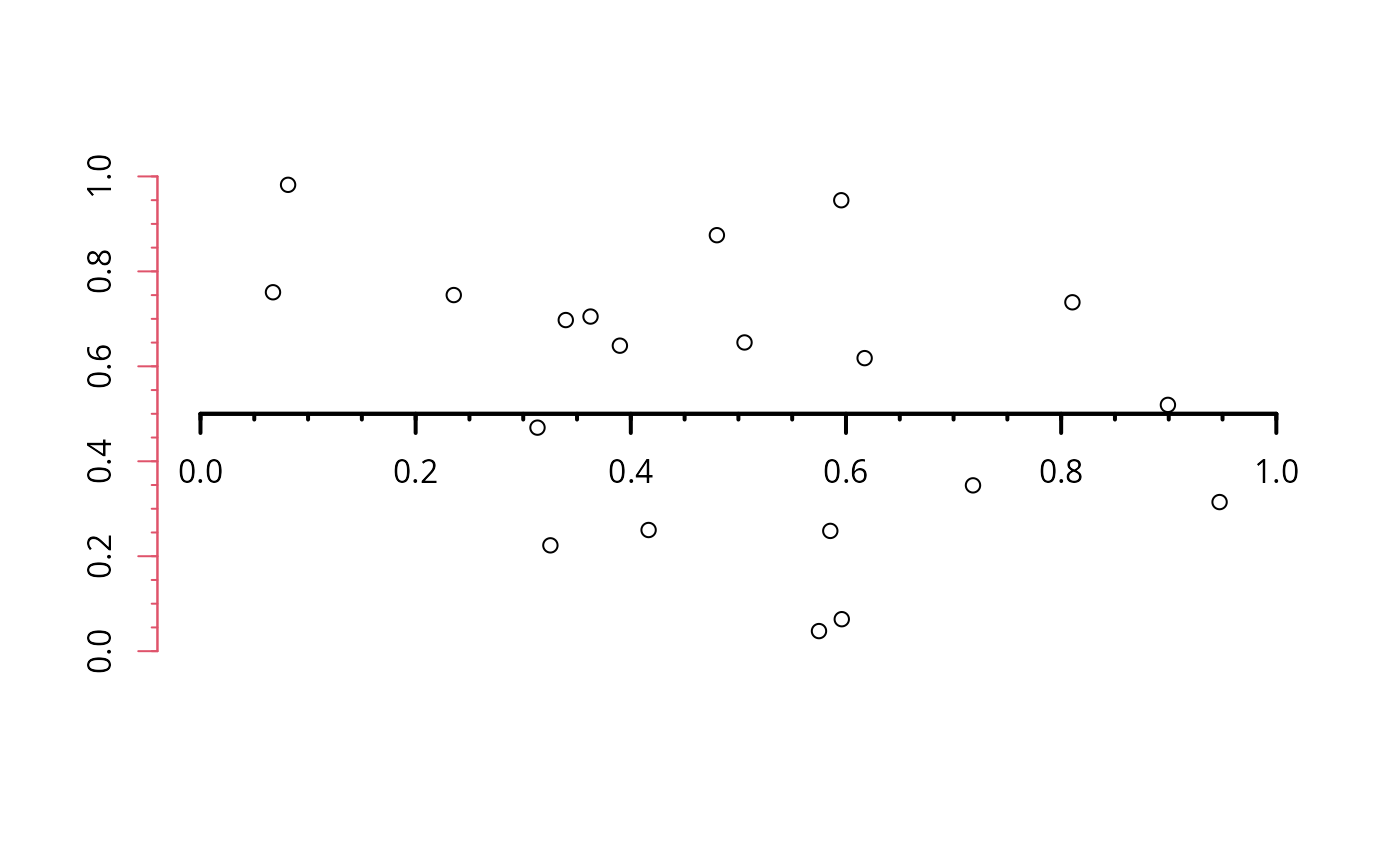
 # Plot with arguments passed to axis()
plot(c(0,1), c(0,1), type = 'n', axes = FALSE, ann = FALSE)
# setting up a plot without axes and annotation
points(runif(20), runif(20)) # plotting data
axis(1, pos = 0.5, lwd = 2) # showing X-axis at Y = 0.5 with formatting
axis(2, col = 2) # formatted Y-axis
minor.tick( nx = 4, ny = 4, tick.ratio = 0.3,
x.args = list(pos = 0.5, lwd = 2), # X-minor tick format argumnets
y.args = list(col = 2)) # Y-minor tick format arguments
# Plot with arguments passed to axis()
plot(c(0,1), c(0,1), type = 'n', axes = FALSE, ann = FALSE)
# setting up a plot without axes and annotation
points(runif(20), runif(20)) # plotting data
axis(1, pos = 0.5, lwd = 2) # showing X-axis at Y = 0.5 with formatting
axis(2, col = 2) # formatted Y-axis
minor.tick( nx = 4, ny = 4, tick.ratio = 0.3,
x.args = list(pos = 0.5, lwd = 2), # X-minor tick format argumnets
y.args = list(col = 2)) # Y-minor tick format arguments