Back to Back Histograms
histbackback.RdTakes two vectors or a list with x and y components, and produces
back to back histograms of the two datasets.
Usage
histbackback(x, y, brks=NULL, xlab=NULL, axes=TRUE, probability=FALSE,
             xlim=NULL, ylab='', ...)
Arguments
- x,y
either two vectors or a list given as
xwith two components. If the components have names, they will be used to label the axis (modification FEH).- brks
vector of the desired breakpoints for the histograms.
- xlab
a vector of two character strings naming the two datasets.
- axes
logical flag stating whether or not to label the axes.
- probability
logical flag: if
TRUE, then the x-axis corresponds to the units for a density. IfFALSE, then the units are counts.- xlim
x-axis limits. First value must be negative, as the left histogram is placed at negative x-values. Second value must be positive, for the right histogram. To make the limits symmetric, use e.g.
ylim=c(-20,20).- ylab
label for y-axis. Default is no label.
- ...
additional graphics parameters may be given.
Value
a list is returned invisibly with the following components:
- left
the counts for the dataset plotted on the left.
- right
the counts for the dataset plotted on the right.
- breaks
the breakpoints used.
Author
Pat Burns
Salomon Smith Barney
London
pburns@dorado.sbi.com
Examples
options(digits=3)
set.seed(1)
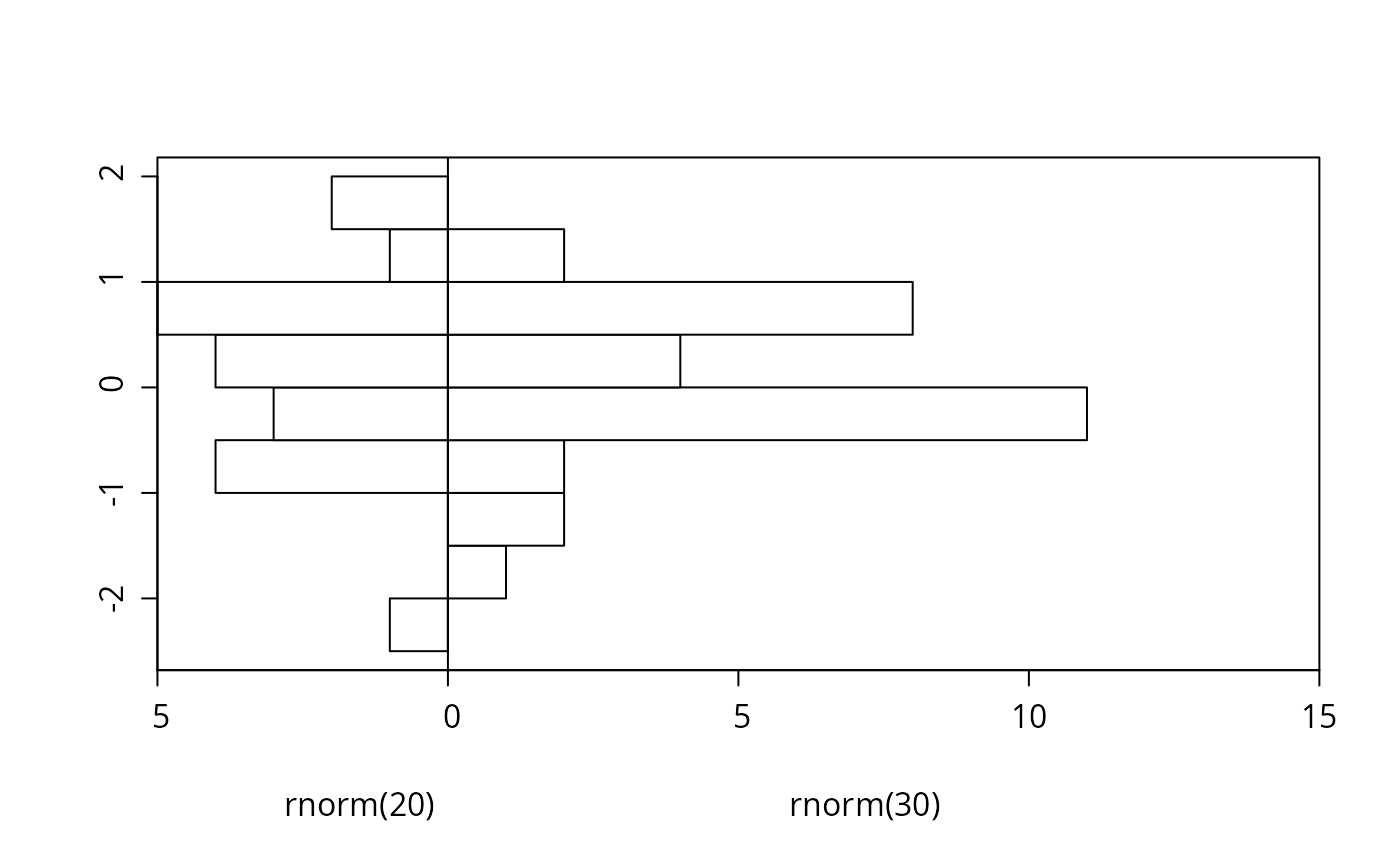
histbackback(rnorm(20), rnorm(30))
 fool <- list(x=rnorm(40), y=rnorm(40))
histbackback(fool)
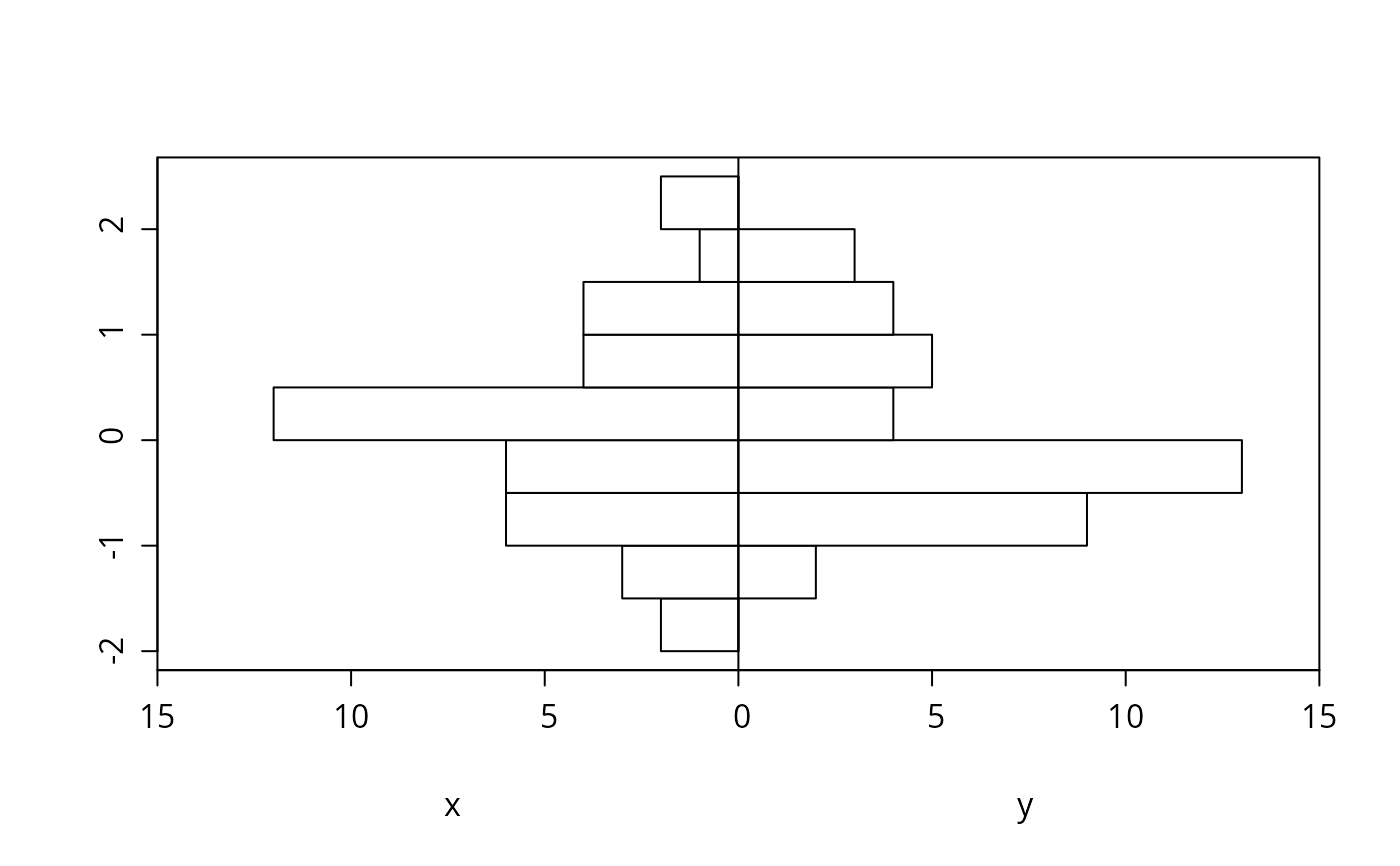
fool <- list(x=rnorm(40), y=rnorm(40))
histbackback(fool)
 age <- rnorm(1000,50,10)
sex <- sample(c('female','male'),1000,TRUE)
histbackback(split(age, sex))
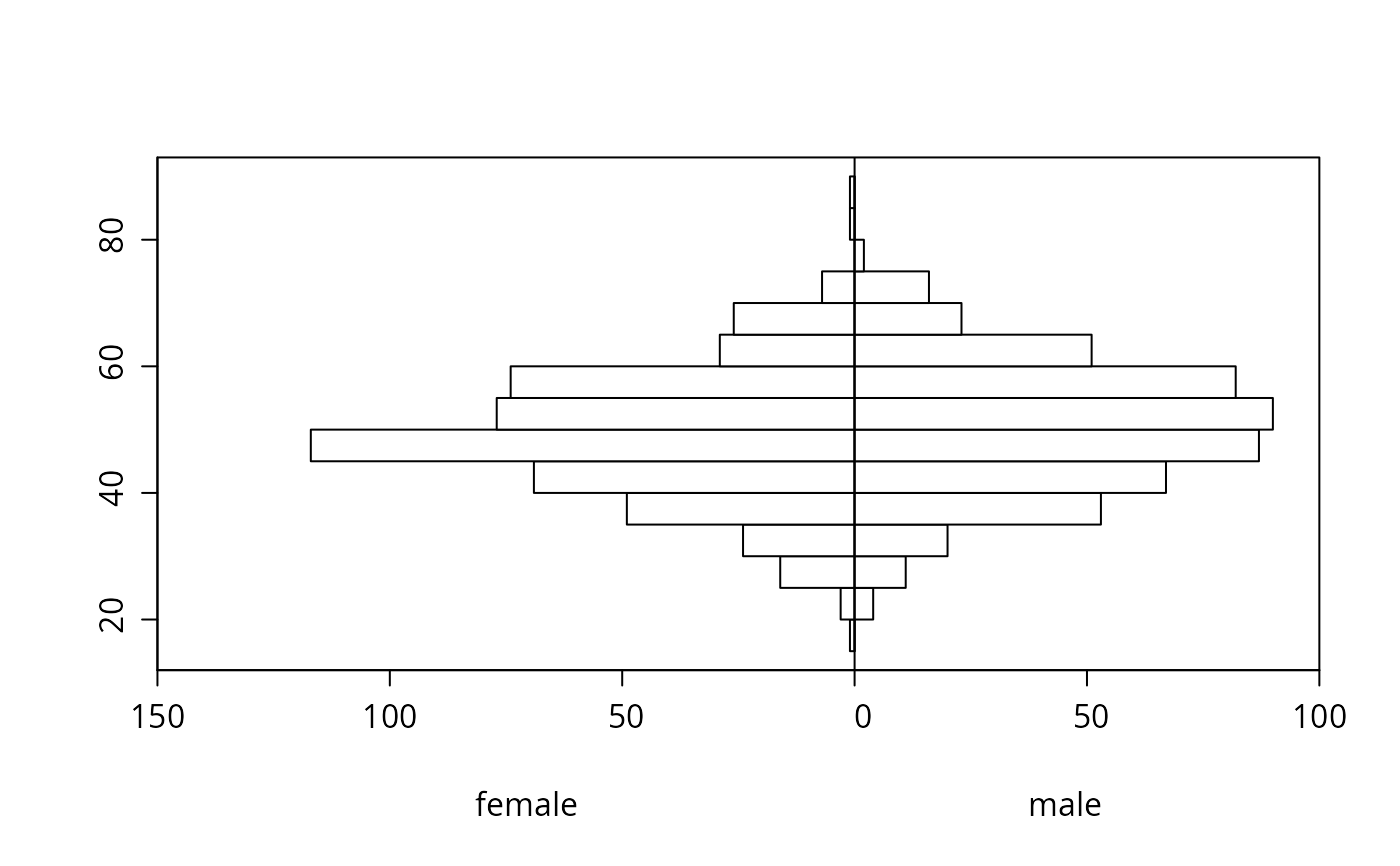
age <- rnorm(1000,50,10)
sex <- sample(c('female','male'),1000,TRUE)
histbackback(split(age, sex))
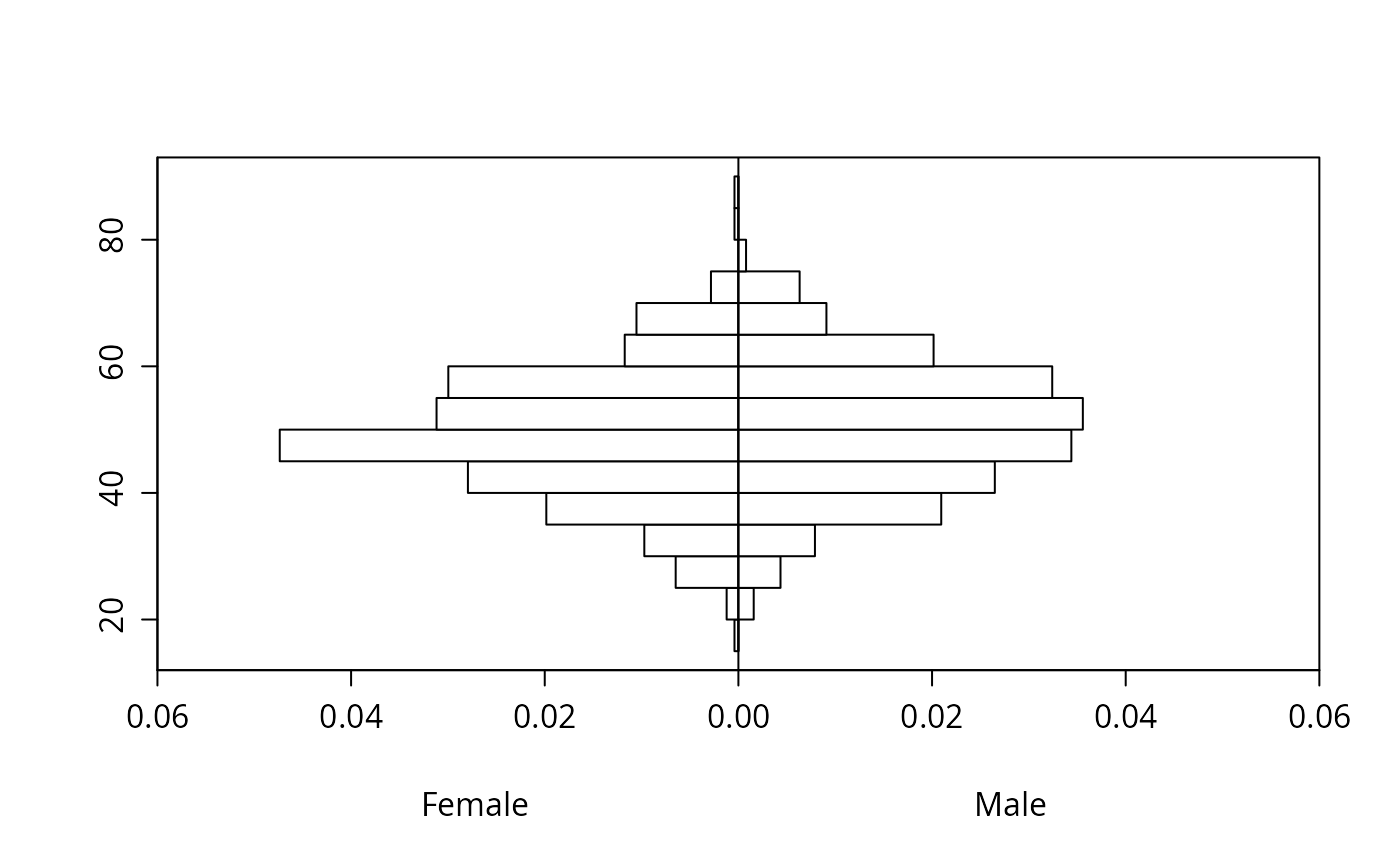
 agef <- age[sex=='female']; agem <- age[sex=='male']
histbackback(list(Female=agef,Male=agem), probability=TRUE, xlim=c(-.06,.06))
agef <- age[sex=='female']; agem <- age[sex=='male']
histbackback(list(Female=agef,Male=agem), probability=TRUE, xlim=c(-.06,.06))