Plot Error Bars
errbar.RdAdd vertical error bars to an existing plot or makes a new plot with error bars.
Usage
errbar(x, y, yplus, yminus, cap=0.015, main = NULL,
       sub=NULL, xlab=as.character(substitute(x)),
       ylab=if(is.factor(x) || is.character(x)) ""
           else as.character(substitute(y)),
       add=FALSE, lty=1, type='p', ylim=NULL,
       lwd=1, pch=16, errbar.col, Type=rep(1, length(y)),
       ...)
Arguments
- x
vector of numeric x-axis values (for vertical error bars) or a factor or character variable (for horizontal error bars,
xrepresenting the group labels)- y
vector of y-axis values.
- yplus
vector of y-axis values: the tops of the error bars.
- yminus
vector of y-axis values: the bottoms of the error bars.
- cap
the width of the little lines at the tops and bottoms of the error bars in units of the width of the plot. Defaults to
0.015.- main
a main title for the plot, passed to
plot, see alsotitle.- sub
a sub title for the plot, passed to
plot- xlab
optional x-axis labels if
add=FALSE.- ylab
optional y-axis labels if
add=FALSE. Defaults to blank for horizontal charts.- add
set to
TRUEto add bars to an existing plot (available only for vertical error bars)- lty
type of line for error bars
- type
type of point. Use
type="b"to connect dots.- ylim
y-axis limits. Default is to use range of
y,yminus, andyplus. For horizonal charts,ylimis really thex-axis range, excluding differences.- lwd
line width for line segments (not main line)
- pch
character to use as the point.
- errbar.col
color to use for drawing error bars.
- Type
used for horizontal bars only. Is an integer vector with values
1if corresponding values represent simple estimates,2if they represent differences.- ...
other parameters passed to all graphics functions.
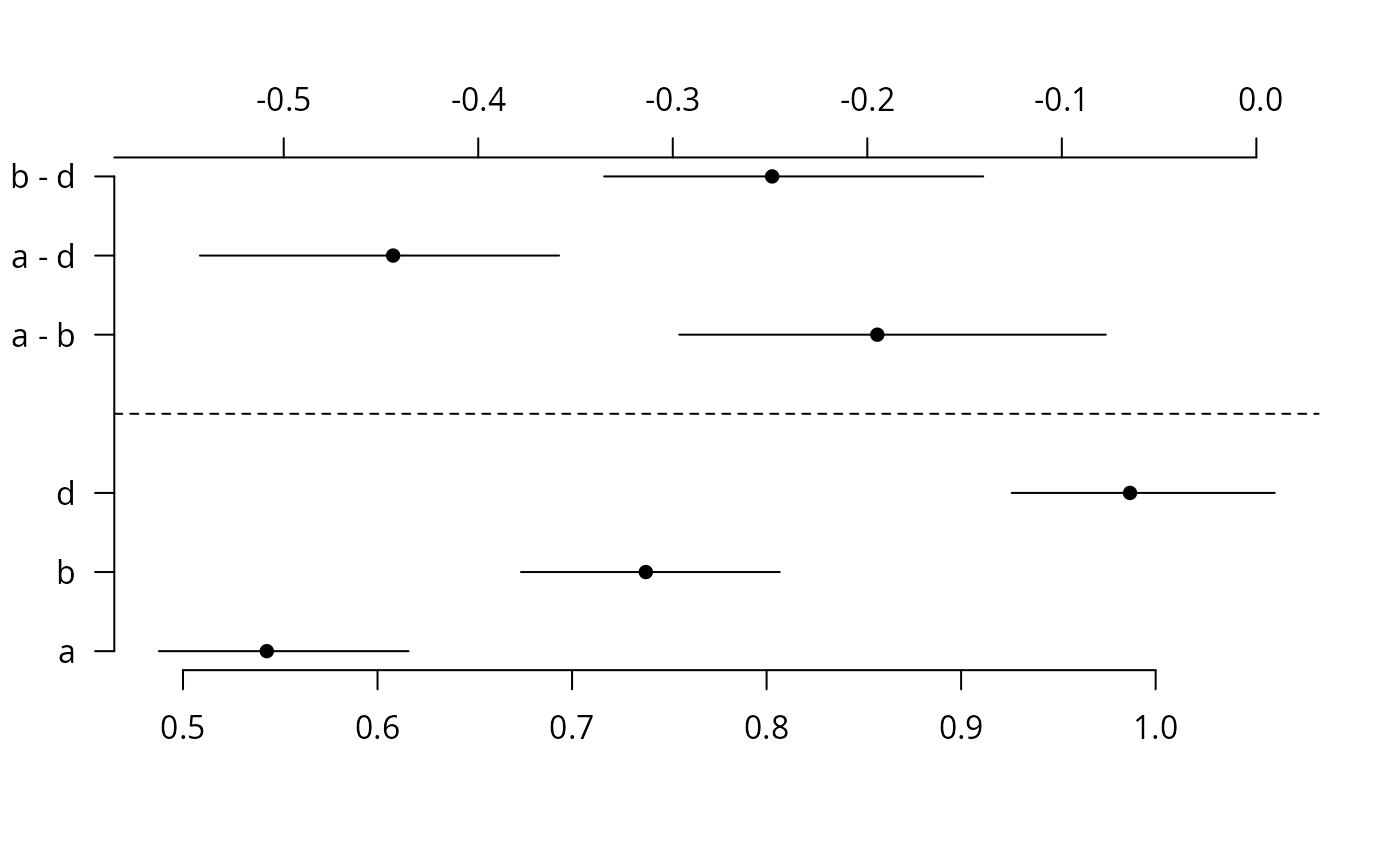
Details
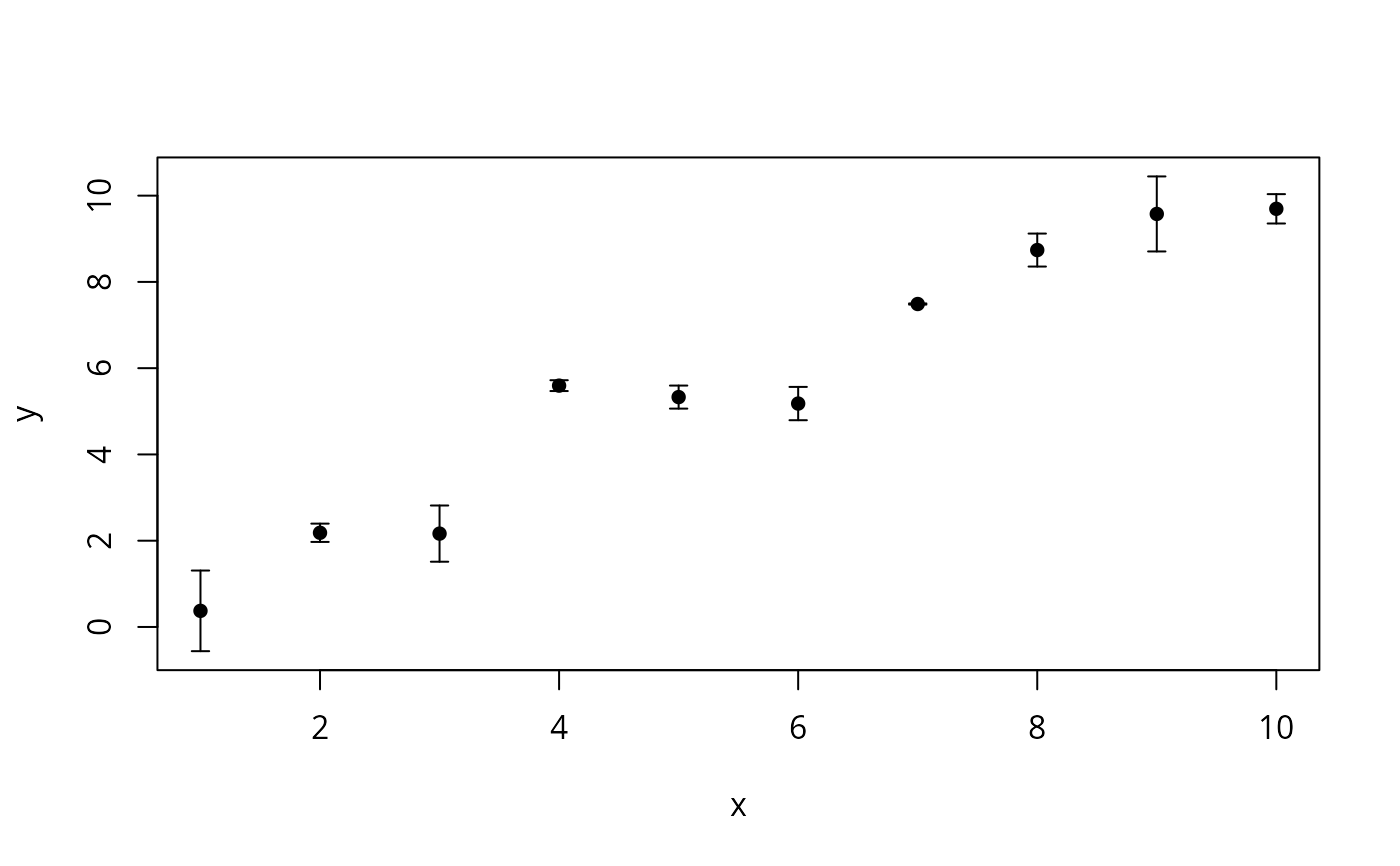
errbar adds vertical error bars to an existing plot or makes a new
plot with error bars. It can also make a horizontal error bar plot
that shows error bars for group differences as well as bars for
groups. For the latter type of plot, the lower x-axis scale
corresponds to group estimates and the upper scale corresponds to
differences. The spacings of the two scales are identical but the
scale for differences has its origin shifted so that zero may be
included. If at least one of the confidence intervals includes zero,
a vertical dotted reference line at zero is drawn.
Author
Charles Geyer, University of Chicago. Modified by Frank Harrell,
Vanderbilt University, to handle missing data, to add the parameters
add and lty, and to implement horizontal charts with differences.
Examples
set.seed(1)
x <- 1:10
y <- x + rnorm(10)
delta <- runif(10)
errbar( x, y, y + delta, y - delta )


# Show bootstrap nonparametric CLs for 3 group means and for
# pairwise differences on same graph
group <- sample(c('a','b','d'), 200, TRUE)
y     <- runif(200) + .25*(group=='b') + .5*(group=='d')
cla <- smean.cl.boot(y[group=='a'],B=100,reps=TRUE)  # usually B=1000
a   <- attr(cla,'reps')
clb <- smean.cl.boot(y[group=='b'],B=100,reps=TRUE)
b   <- attr(clb,'reps')
cld <- smean.cl.boot(y[group=='d'],B=100,reps=TRUE)
d   <- attr(cld,'reps')
a.b <- quantile(a-b,c(.025,.975))
a.d <- quantile(a-d,c(.025,.975))
b.d <- quantile(b-d,c(.025,.975))
errbar(c('a','b','d','a - b','a - d','b - d'),
       c(cla[1],clb[1],cld[1],cla[1]-clb[1],cla[1]-cld[1],clb[1]-cld[1]),
       c(cla[3],clb[3],cld[3],a.b[2],a.d[2],b.d[2]),
       c(cla[2],clb[2],cld[2],a.b[1],a.d[1],b.d[1]),
       Type=c(1,1,1,2,2,2), xlab='', ylab='')
# Show bootstrap nonparametric CLs for 3 group means and for
# pairwise differences on same graph
group <- sample(c('a','b','d'), 200, TRUE)
y <- runif(200) + .25*(group=='b') + .5*(group=='d')
cla <- smean.cl.boot(y[group=='a'],B=100,reps=TRUE) # usually B=1000
a <- attr(cla,'reps')
clb <- smean.cl.boot(y[group=='b'],B=100,reps=TRUE)
b <- attr(clb,'reps')
cld <- smean.cl.boot(y[group=='d'],B=100,reps=TRUE)
d <- attr(cld,'reps')
a.b <- quantile(a-b,c(.025,.975))
a.d <- quantile(a-d,c(.025,.975))
b.d <- quantile(b-d,c(.025,.975))
errbar(c('a','b','d','a - b','a - d','b - d'),
c(cla[1],clb[1],cld[1],cla[1]-clb[1],cla[1]-cld[1],clb[1]-cld[1]),
c(cla[3],clb[3],cld[3],a.b[2],a.d[2],b.d[2]),
c(cla[2],clb[2],cld[2],a.b[1],a.d[1],b.d[1]),
Type=c(1,1,1,2,2,2), xlab='', ylab='')