Enhanced Dot Chart
dotchart2.Rddotchart2 is an enhanced version of the dotchart function
with several new options.
Usage
dotchart2(data, labels, groups=NULL, gdata=NA, horizontal=TRUE, pch=16,
          xlab='', ylab='', xlim=NULL, auxdata, auxgdata=NULL, auxtitle,
          lty=1, lines=TRUE, dotsize = .8,
          cex = par("cex"), cex.labels = cex,
          cex.group.labels = cex.labels*1.25, sort.=TRUE,
        add=FALSE, dotfont=par('font'), groupfont=2,
        reset.par=add, xaxis=TRUE, width.factor=1.1,
          lcolor='gray', leavepar=FALSE,
          axisat=NULL, axislabels=NULL, ...)
Arguments
- data
a numeric vector whose values are shown on the x-axis
- labels
a vector of labels for each point, corresponding to
x. If omitted,names(data)are used, and if there are nonames, integers prefixed by"#"are used.- groups
an optional categorical variable indicating how
datavalues are grouped- gdata
data values for groups, typically summaries such as group medians
- horizontal
set to
FALSEto make the chart vertical instead of the default- pch
default character number or value for plotting dots in dot charts. The default is 16.
- xlab
x-axis title
- ylab
y-axis title
- xlim
x-axis limits. Applies only to
horizontal=TRUE.- auxdata
a vector of auxiliary data given to
dotchart2, of the same length as the first (data) argument. If present, this vector of values will be printed outside the right margin of the dot chart. Usuallyauxdatarepresents cell sizes.- auxgdata
similar to
auxdatabut corresponding to thegdataargument. These usually represent overall sample sizes for each group of lines.- auxtitle
if
auxdatais given,auxtitlespecifies a column heading for the extra printed data in the chart, e.g.,"N"- lty
line type for horizontal lines. Default is 1 for R, 2 for S-Plus
- lines
set to
FALSEto suppress drawing of reference lines- dotsize
cexvalue for drawing dots. Default is 0.8. Note that the originaldotchartfunction used a default of 1.2.- cex
see
par- cex.labels
cexparameter that applies only to the line labels for the dot chartcexparameter for major grouping labels fordotchart2. Defaults tocex.- cex.group.labels
value of
cexcorresponding togdata- sort.
set to
FALSEto keepdotchart2from sorting the input data, i.e., it will assume that the data are already properly arranged. This is especially useful when you are usinggdataandgroupsand you want to control the order that groups appear on the chart (from top to bottom).- add
set to
TRUEto add to an existing plot- dotfont
font number of plotting dots. Default is one. Use
-1to use "outline" fonts. For example,pch=183, dotfont=-1plots an open circle for UNIX on postscript.pch=1makes an open octagon under Windows.- groupfont
font number to use in drawing
grouplabels fordotchart2. Default is2for boldface.- reset.par
set to
FALSEto causedotchart2to not reset theparparameters when finished. This is useful whenadd=TRUEis about to be used in another call. The default is to reset theparparameters ifadd=TRUEand not ifadd=FALSE, i.e., the program assumes that only one set of points will be added to an existing set. If you fail to usereset.par=TRUEfor the first of a series of plots, the next call toplotwithadd=TRUEwill result in distorted x-axis scaling.- xaxis
set to
FALSEto suppress drawing x-axis- width.factor
When the calculated left margin turns out to be faulty, specify a factor by which to multiple the left margin as
width.factorto get the appropriate space for labels on horizonal charts.- lcolor
color for horizontal reference lines. Default is
"gray"for R,par("col")for S-Plus.- leavepar
set to
TRUEto leavepar()unchanged. This assumes the user has allocated sufficient left and right margins for a horizontal dot chart.- axisat
a vector of tick mark locations to pass to
axis. Useful if transforming the data axis- axislabels
a vector of strings specifying axis tick mark labels. Useful if transforming the data axis
- ...
arguments passed to
plot.default
Author
Frank Harrell
Department of Biostatistics
Vanderbilt University
fh@fharrell.com
Examples
set.seed(135)
maj <- factor(c(rep('North',13),rep('South',13)))
g <- paste('Category',rep(letters[1:13],2))
n <- sample(1:15000, 26, replace=TRUE)
y1 <- runif(26)
y2 <- pmax(0, y1 - runif(26, 0, .1))
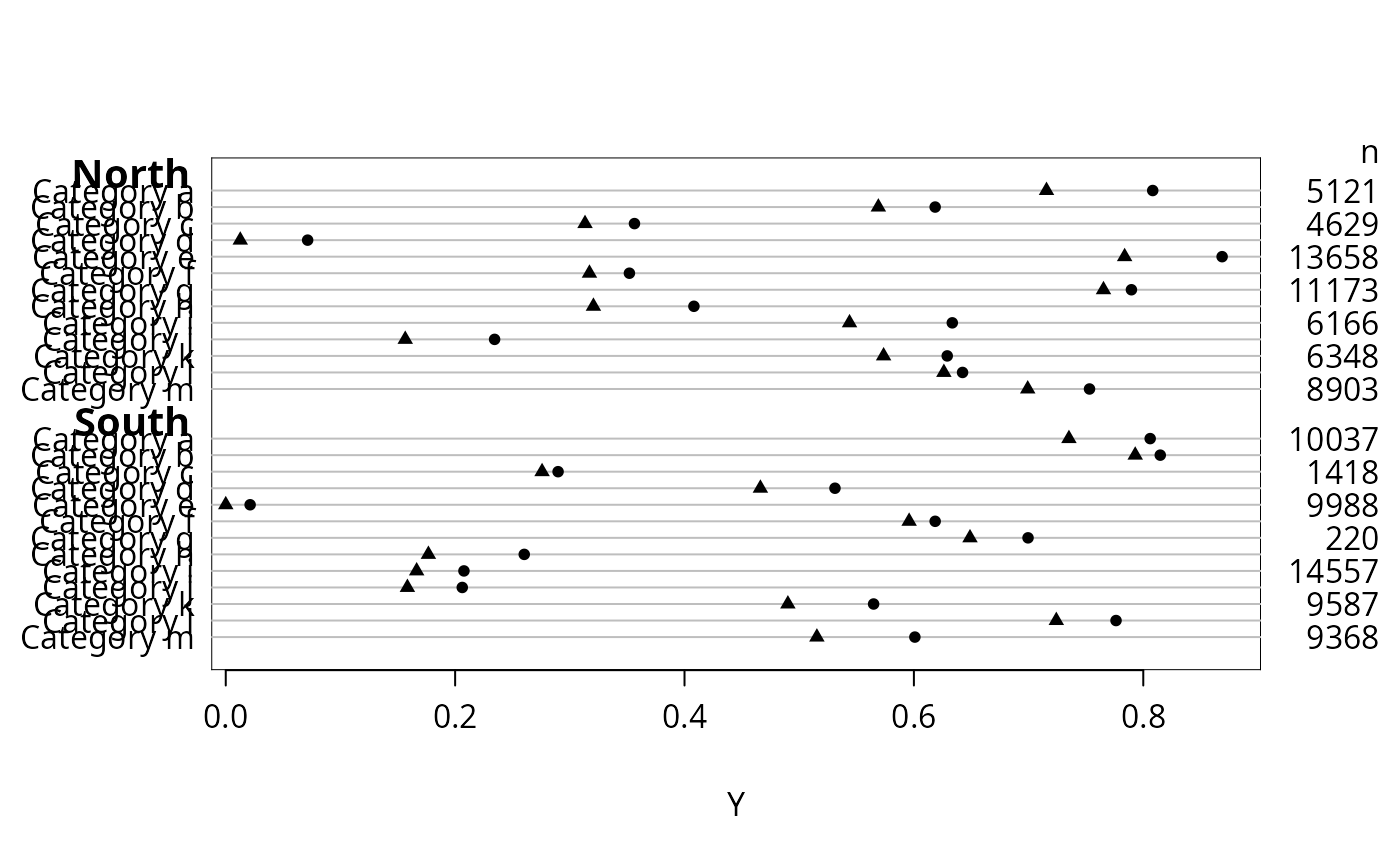
dotchart2(y1, g, groups=maj, auxdata=n, auxtitle='n', xlab='Y')
dotchart2(y2, g, groups=maj, pch=17, add=TRUE)
 ## Compare with dotchart function (no superpositioning or auxdata allowed):
## dotchart(y1, g, groups=maj, xlab='Y')
## To plot using a transformed scale add for example
## axisat=sqrt(pretty(y)), axislabels=pretty(y)
## Compare with dotchart function (no superpositioning or auxdata allowed):
## dotchart(y1, g, groups=maj, xlab='Y')
## To plot using a transformed scale add for example
## axisat=sqrt(pretty(y)), axislabels=pretty(y)